Download CellProfiler
Template Pipeline Files .Zip Link
Analysis Guide
Step 1: Cell Profiler Preprocessing Pipeline – Automated Image Cropping Steps:
1) Establish a central analysis area for where your images will be processed through thee pipeline. It is best to create a space for analysis, and make a copy of your images in this area so that the original images are preserved. This space will be used in the following steps and sections to process through the images.
2) Open “preprocessing – cropping pipeline.cppipe”
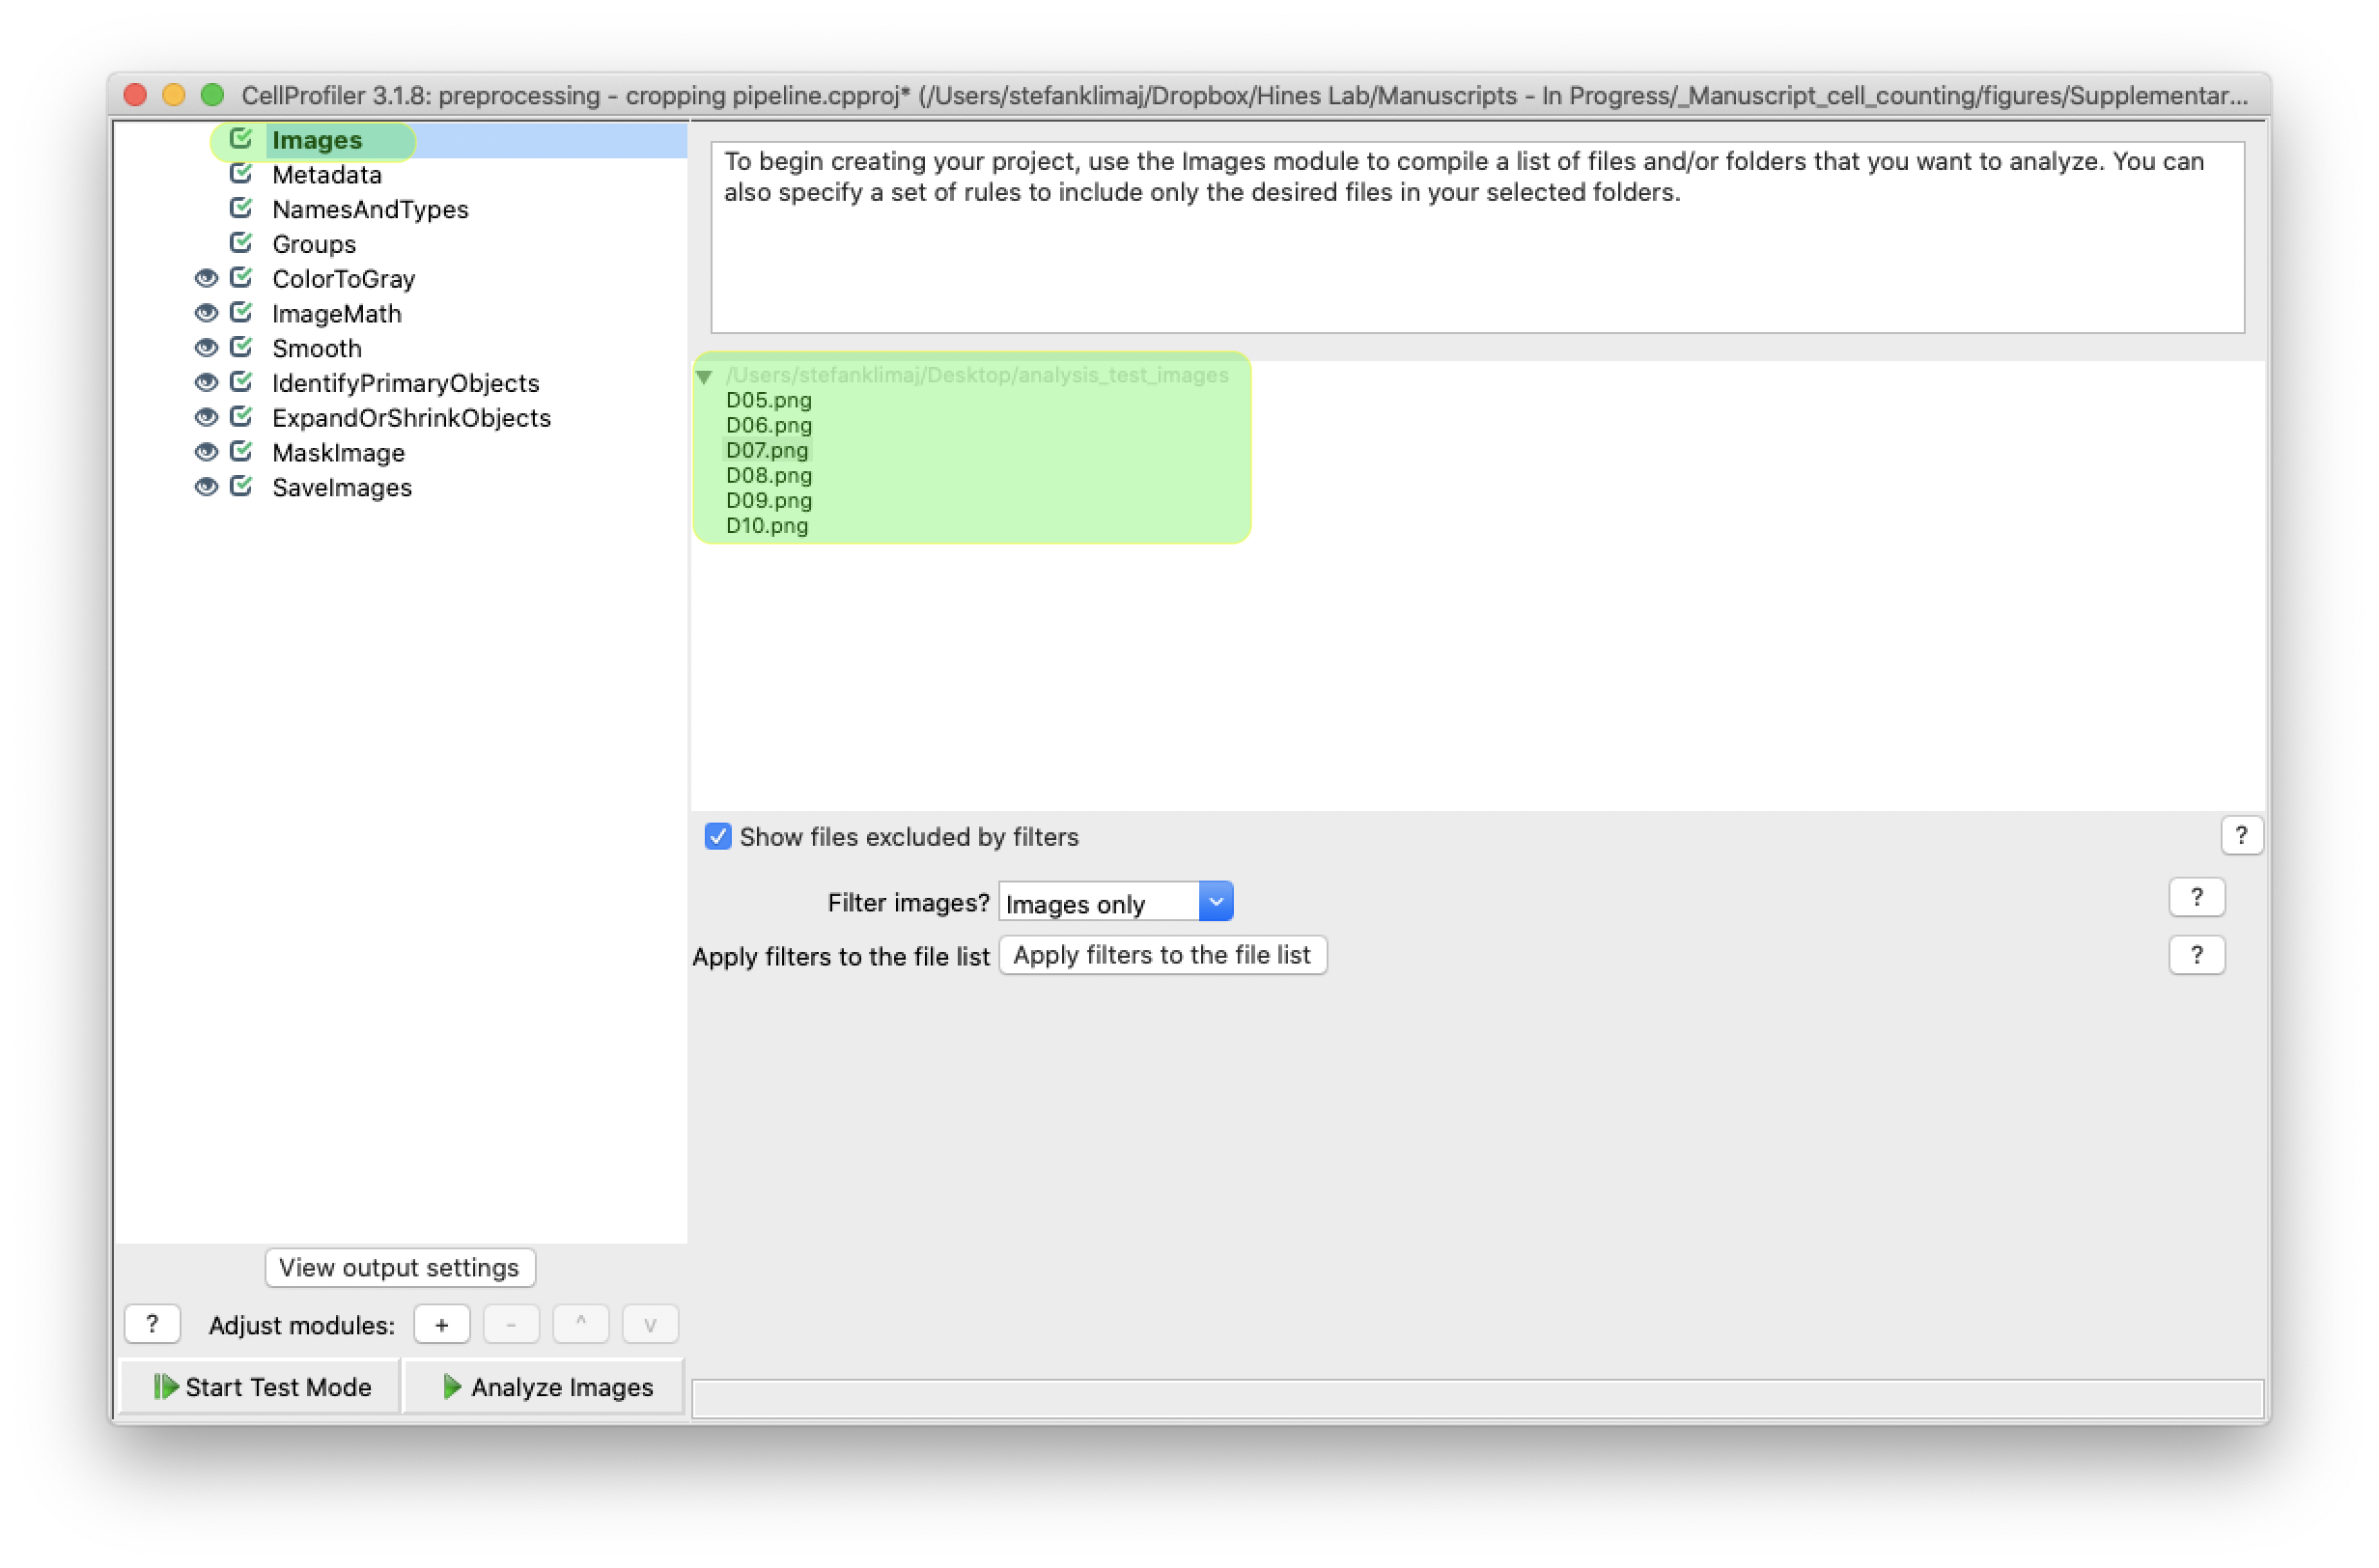
3) From the “images” section, drop your images that are to be analyzed into the drop space
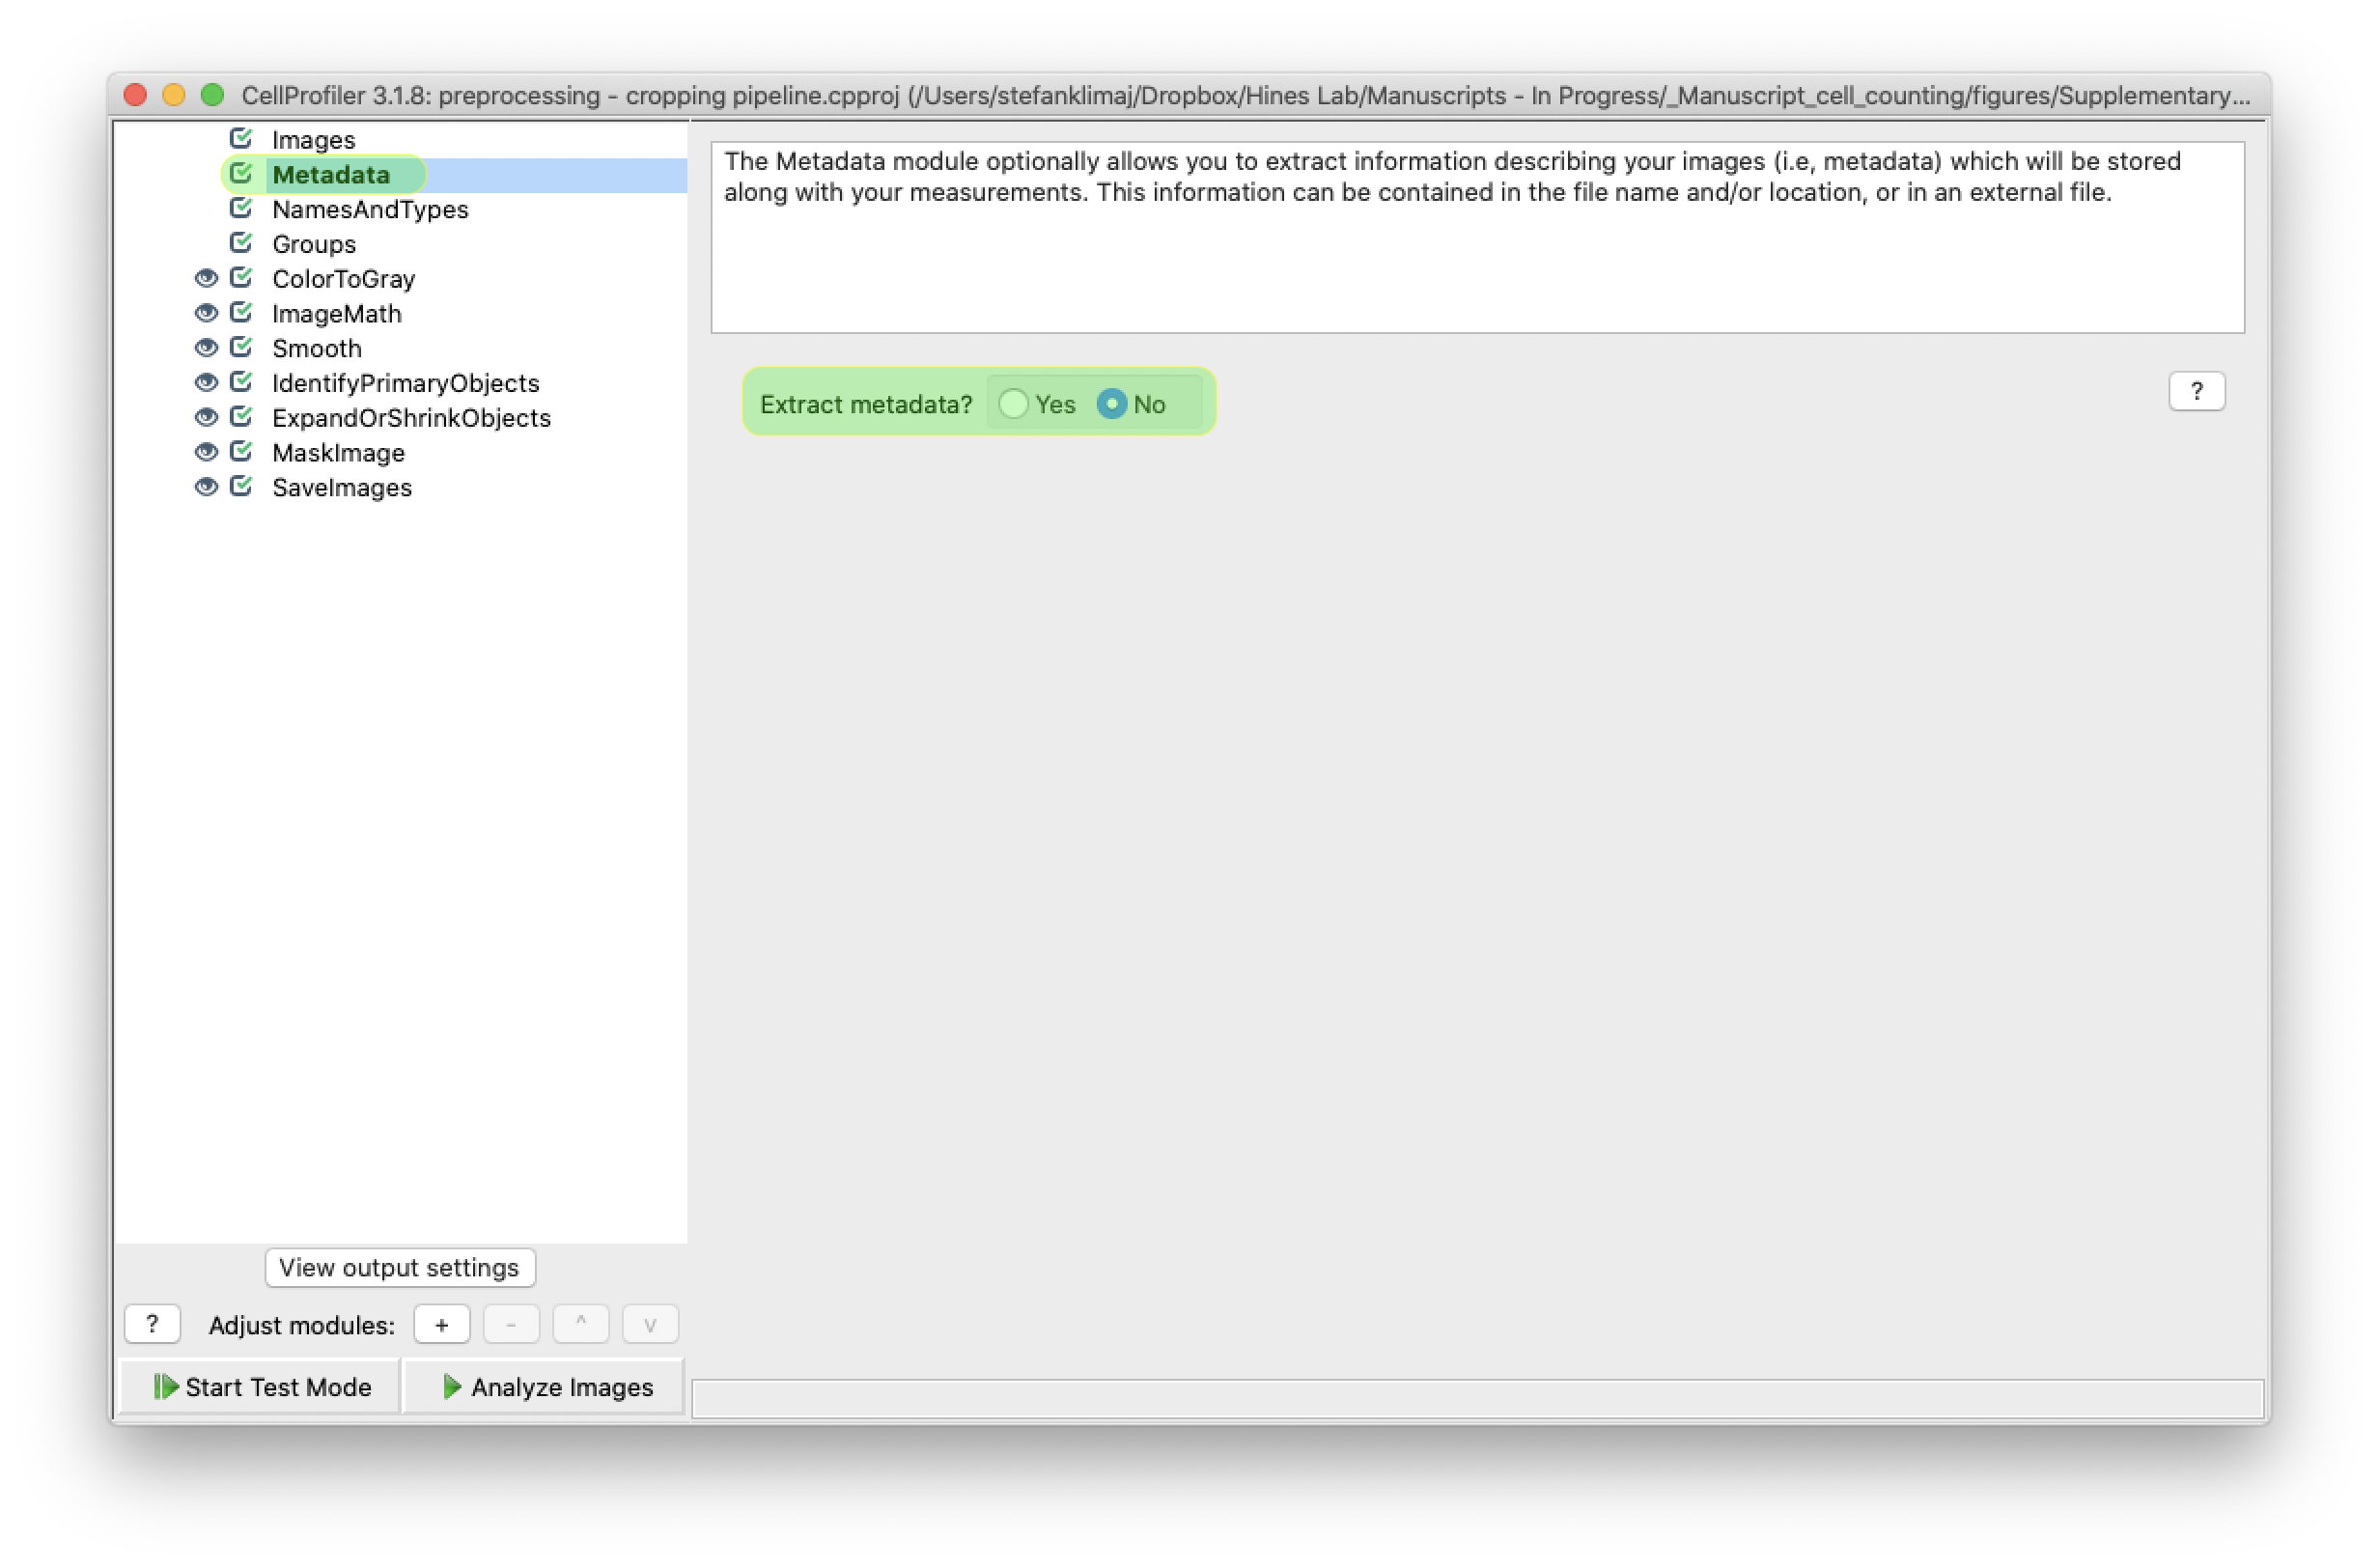
4) From the “metadata” step, establish the criteria by which images are selected for analysis. For this portion of the pipeline it is not being used; but can be if you wish to only preprocess a subset of images from images uploaded in the previous step.
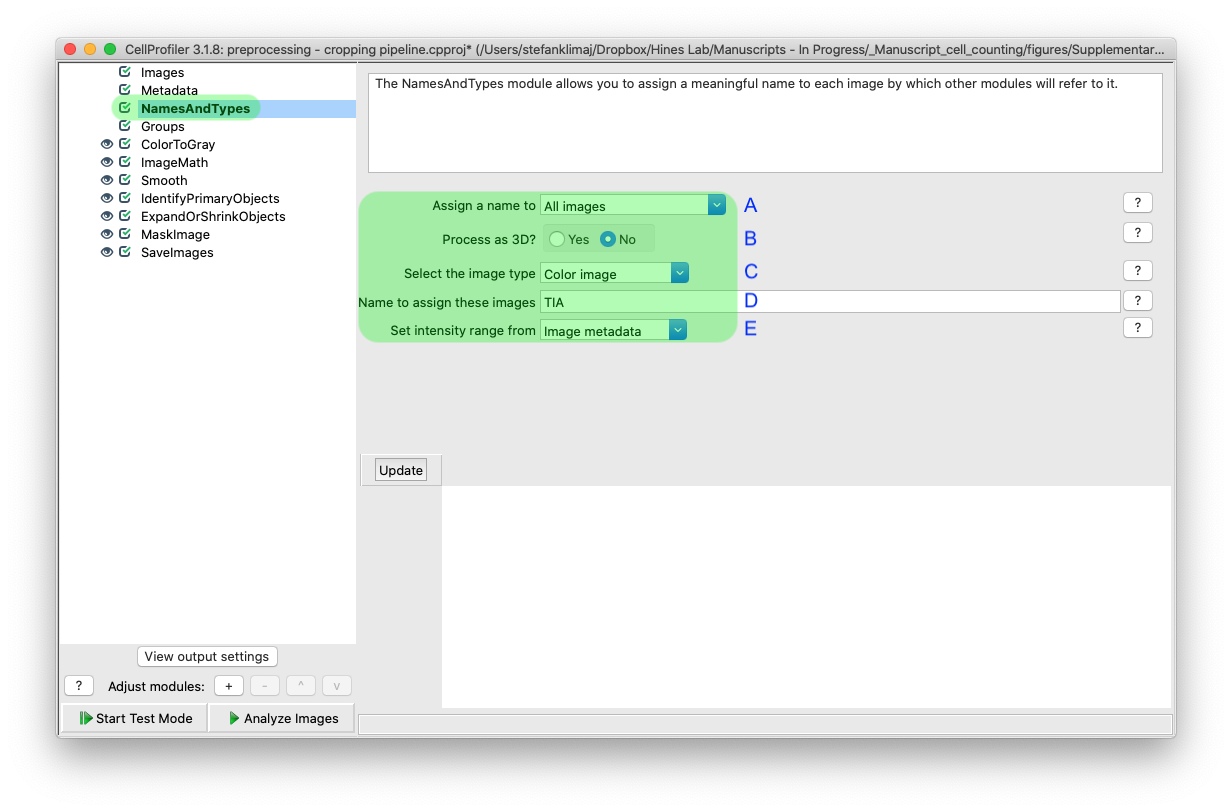
5) From the “names and types” step, you will use the extracted metadata from the previous step (if used) to determine which images are to be analyzed
5A) Since all images will be processed, we will assign the name for this image set to all images
5B) This pipeline is designed to process 2D images, so we are selecting “no” for processing images as 3D
5C) The images have an artificial color applied, and the pipeline will covert back to greyscale in the first processing step
5D) The name assigned will be used through the rest of the pipeline, TIA refers to the experimental acronym used in Hines Lab
5E) The intensity of the images will be extracted from the image metadata, and scaled to a 0 (black) to 1 (white) scale, which will be used later in the pipeline to identify the well halo versus the region of interest (ROI)
Adjusting Modules
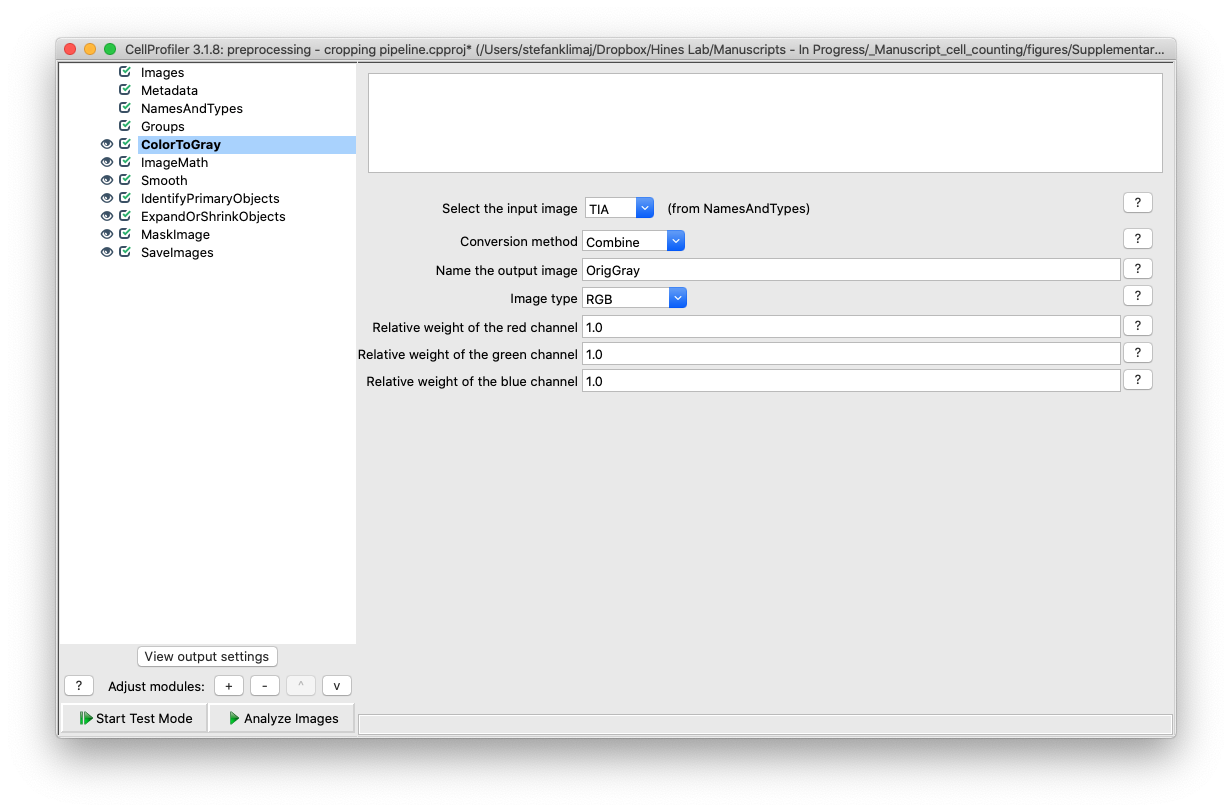
6) Color to gray module – this module converts color images into grayscale; if images are already grayscale, this module can be skipped. Note, the input image name is the same name that is assigned to our group from the “names and types” module
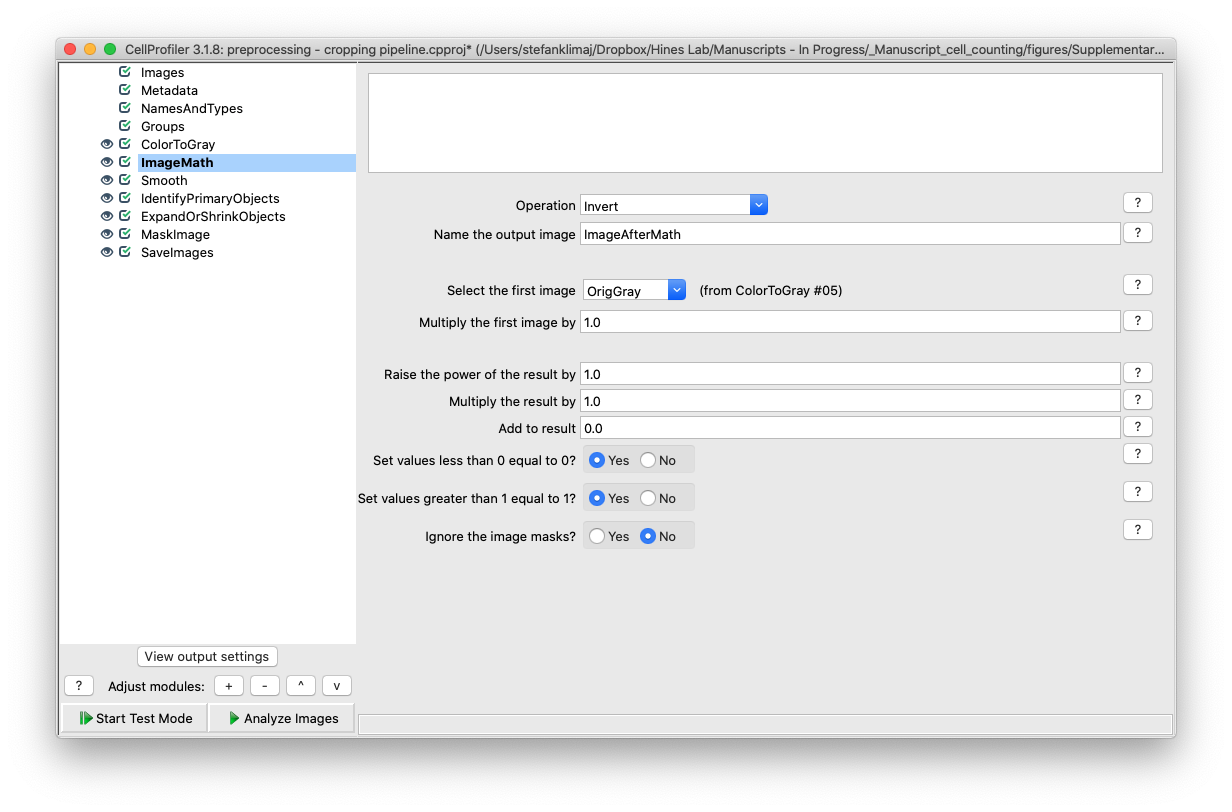
7) Image Math Module – this module will transform the input image into an inverse of its grayscale values, the inverted values will be used in a later module to identify the well images
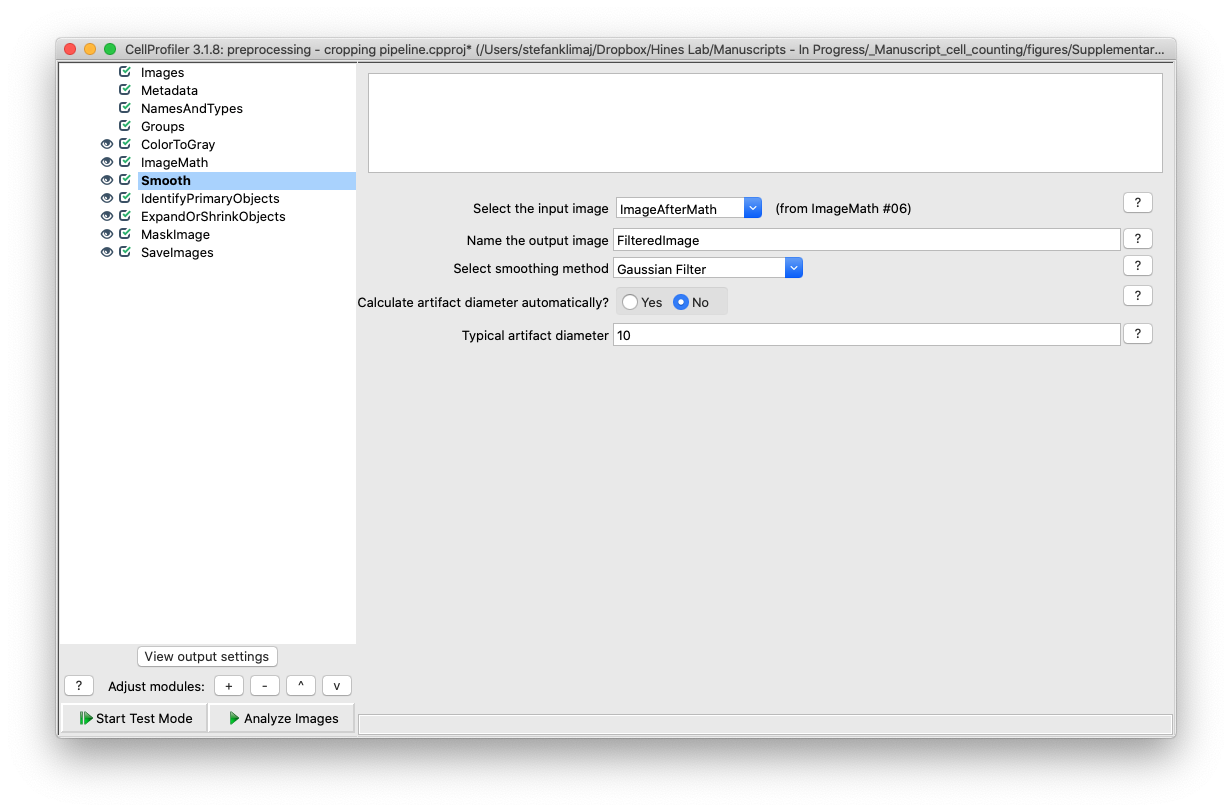
8) Smooth Module – the image from the previous module (Image Math) is smoothed to remove random noise before attempting to identify the well ROI in the next module. A relatively high number for the artifact diameter (10 pixels) is used to soft the image to reduce errors due to variance in the input images
9) Identify Primary Objects Module – this module will be treating the well as it were a single object to identify. This is the module that will require the most adjustment to define the characteristics of the ROI.
9A) The diameter of the well as defined by a minimum and maximum value range that are expected in pixels.
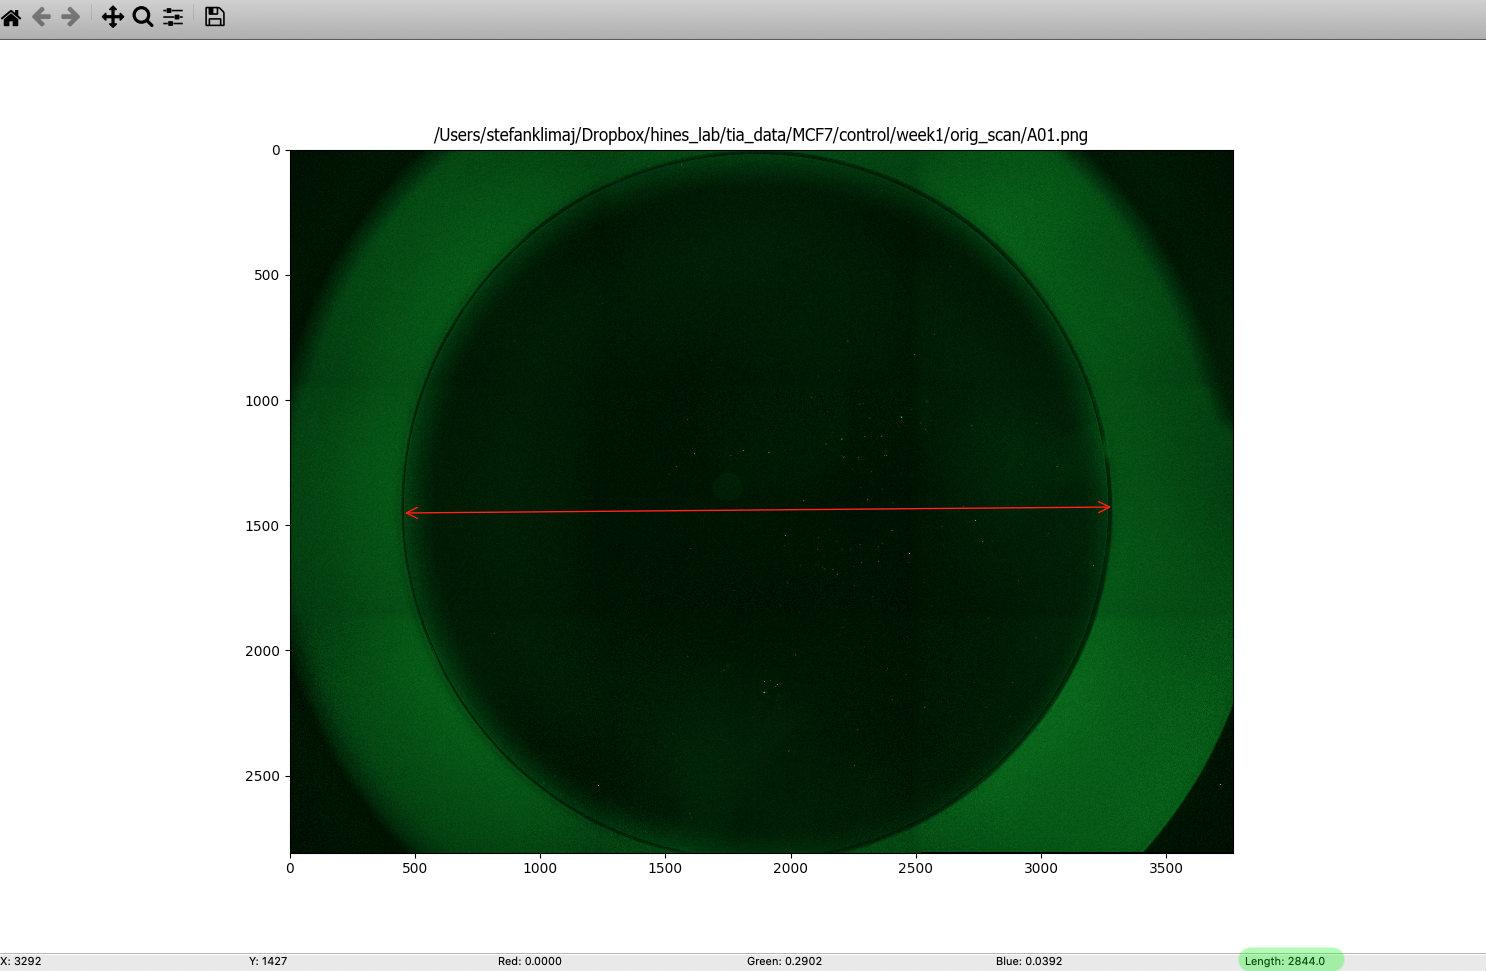
TIP: with CellProfiler open, navigate to file > view image, load a sample image you intend to process, then in the menu bar navigate to Tools > Measure Length, then click and drag from one edge of the well to the opposite side, and at the bottom of the window, the measured value will be displayed (see below)
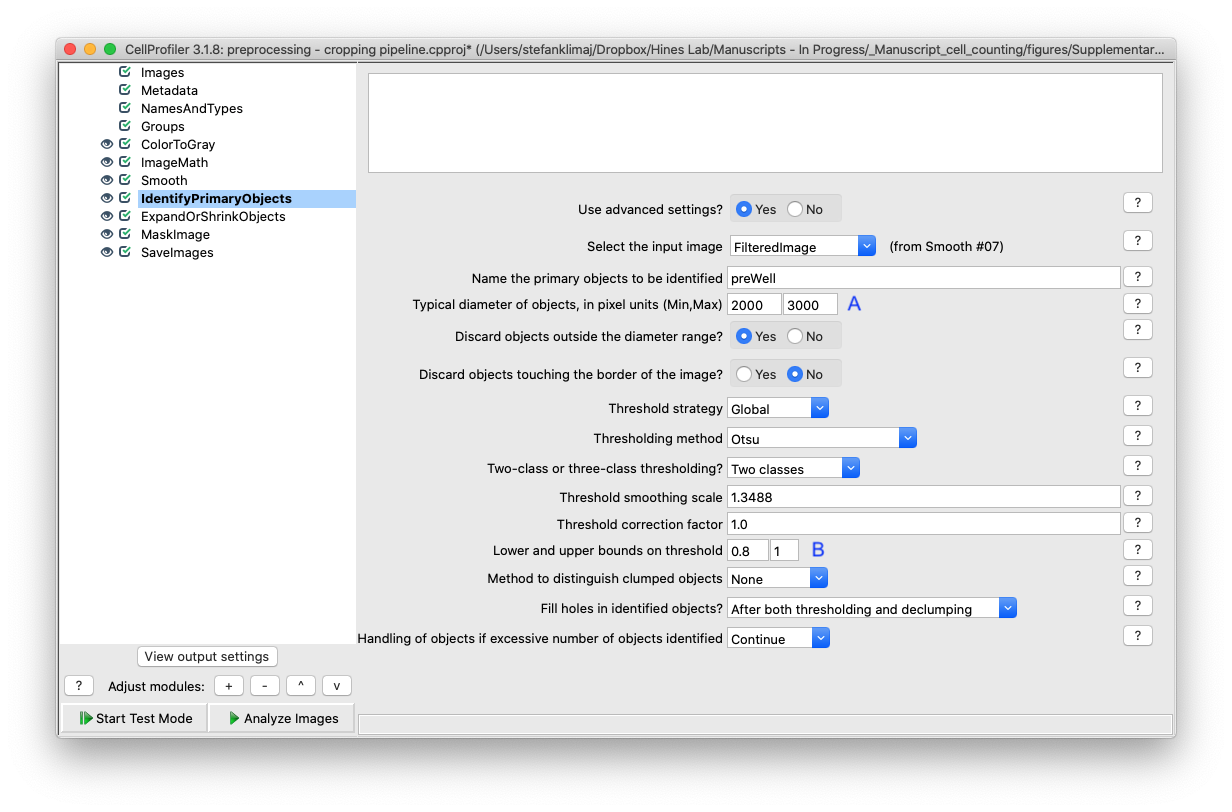
9B) Lower and upper bounds of the threshold will be used to determine the object of interest. Recall that in step 7 (image math module) we inverted the intensity values of the well, and therefore the well itself is now the brightest region of the image, with the well halo now being darker. Changing the lower bound threshold intensity to a higher cutoff (e.g., from 0.8 to 0.9) will make the well identification more narrow.
TIP: (make tip here for how to check intensity values using CP)
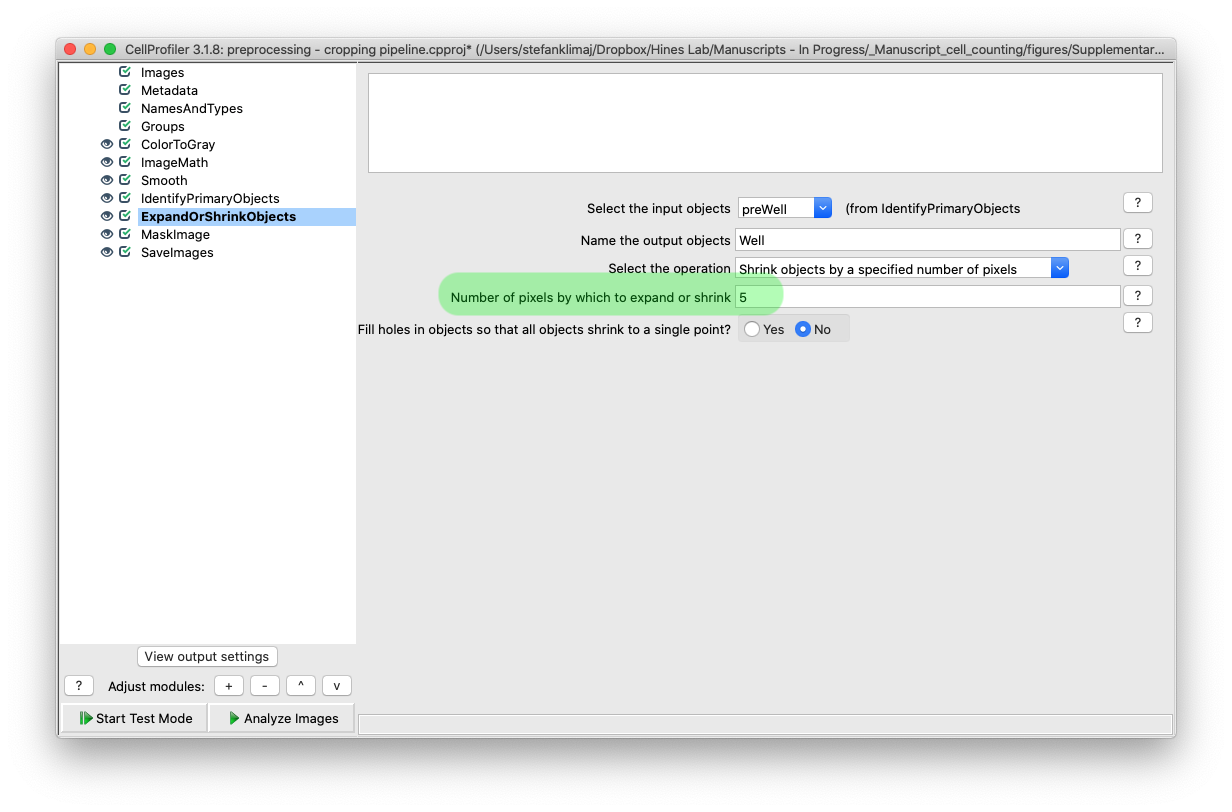
10) Expand or Shrink Objects Module – Once the well is identified so that the halo can be removed, the pixels that are retained can be reduced in size to further remove artifacts; the amount is determined in this module by defining the “number of pixels by which to expand or shrink” the mask that is defined in the previous module. This mask size reduction would be useful to remove lighting artifacts near the edge of the well caused by the growth medium.
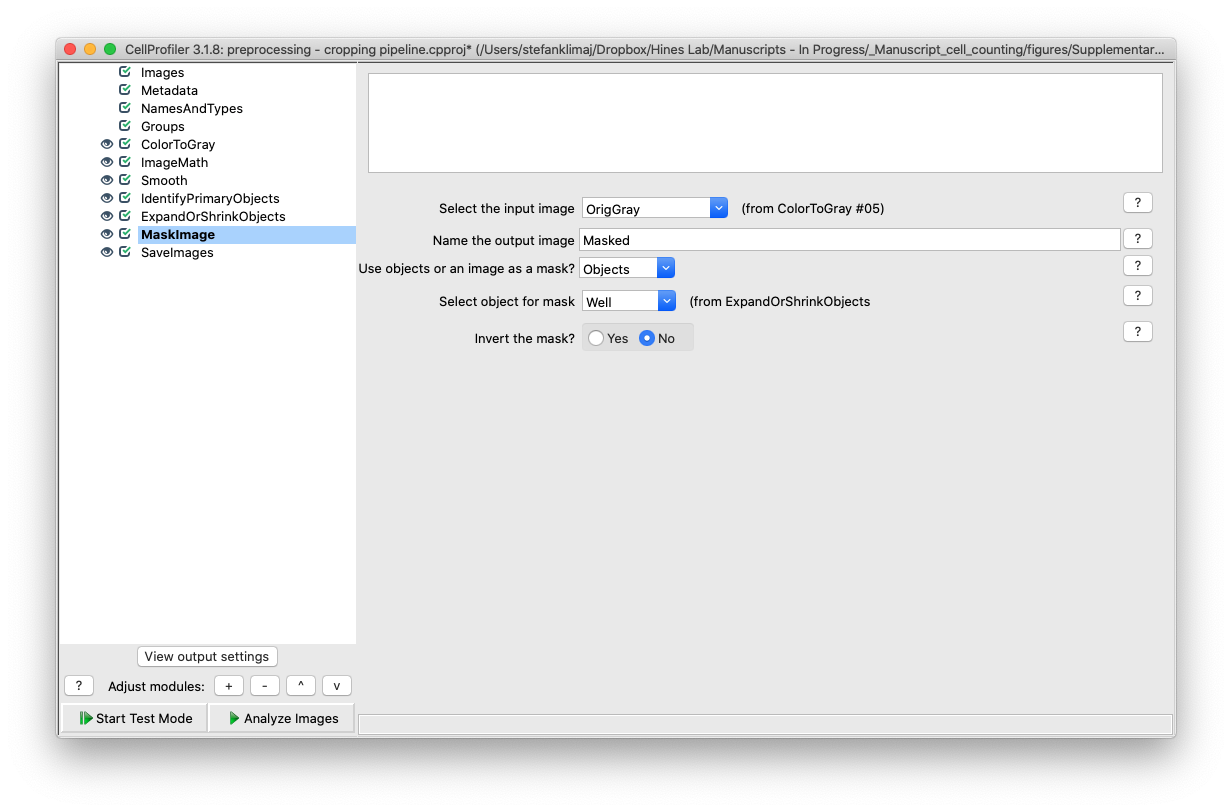
11) Mask Images Module – Finally, the mask is applied back to the input image after it was been converted to gray before it is saved in the next step.
12) Save Images Module – The final module will save the masked images to the default output folder.
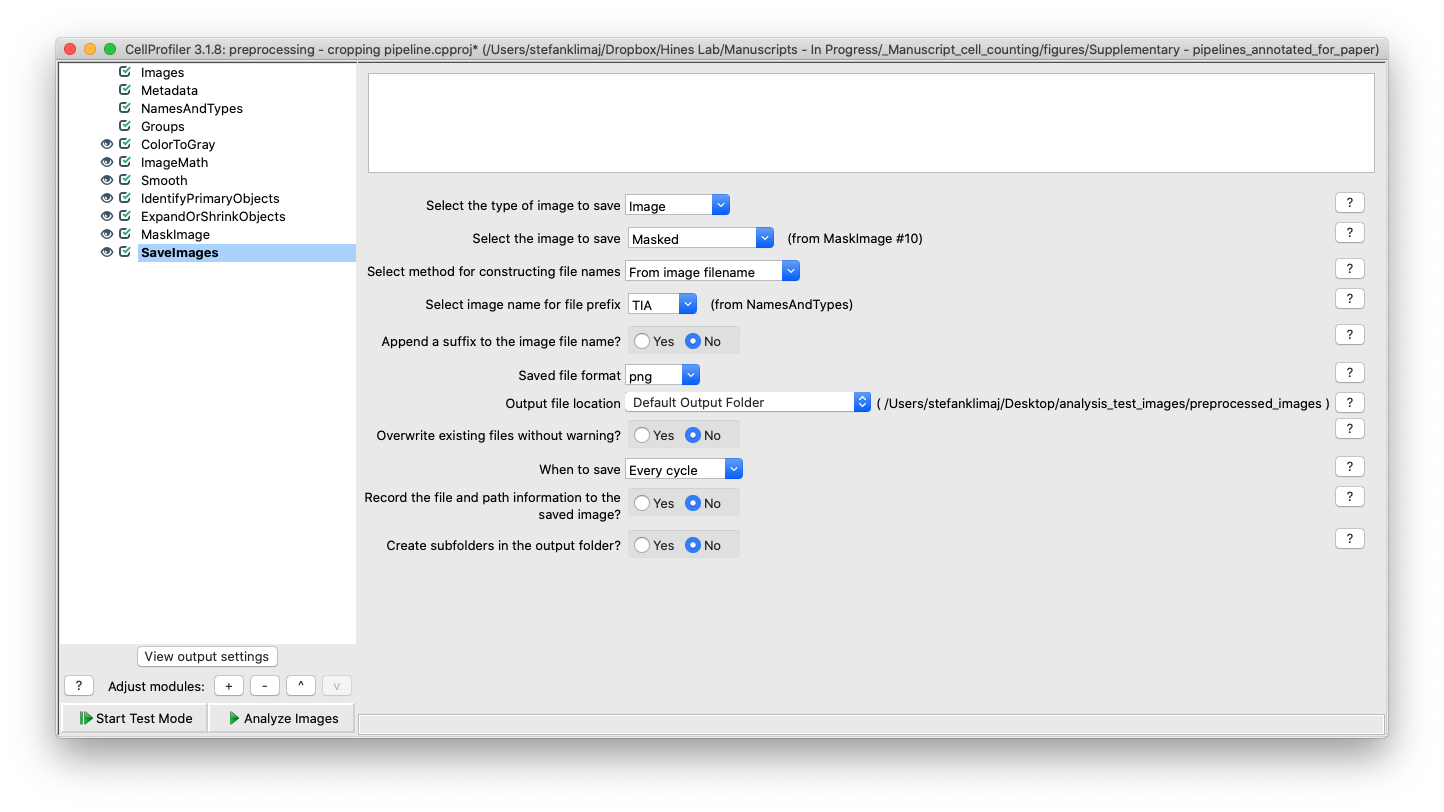
TIP: Having a separate output folder for your processed images is highly recommended, so that original data is not accidentally overwritten (see example below). Where “orig_scan” is where original images are stored and made to be read-only, and the “output” folder is where processed images can be stored and manipulated through each processing step; as well as saving out each pipeline that is used to process images for future reference.

Step 2: Matlab Log Contrast Transformation:
14) Open “preprocessing – log contrast transform.mlx”
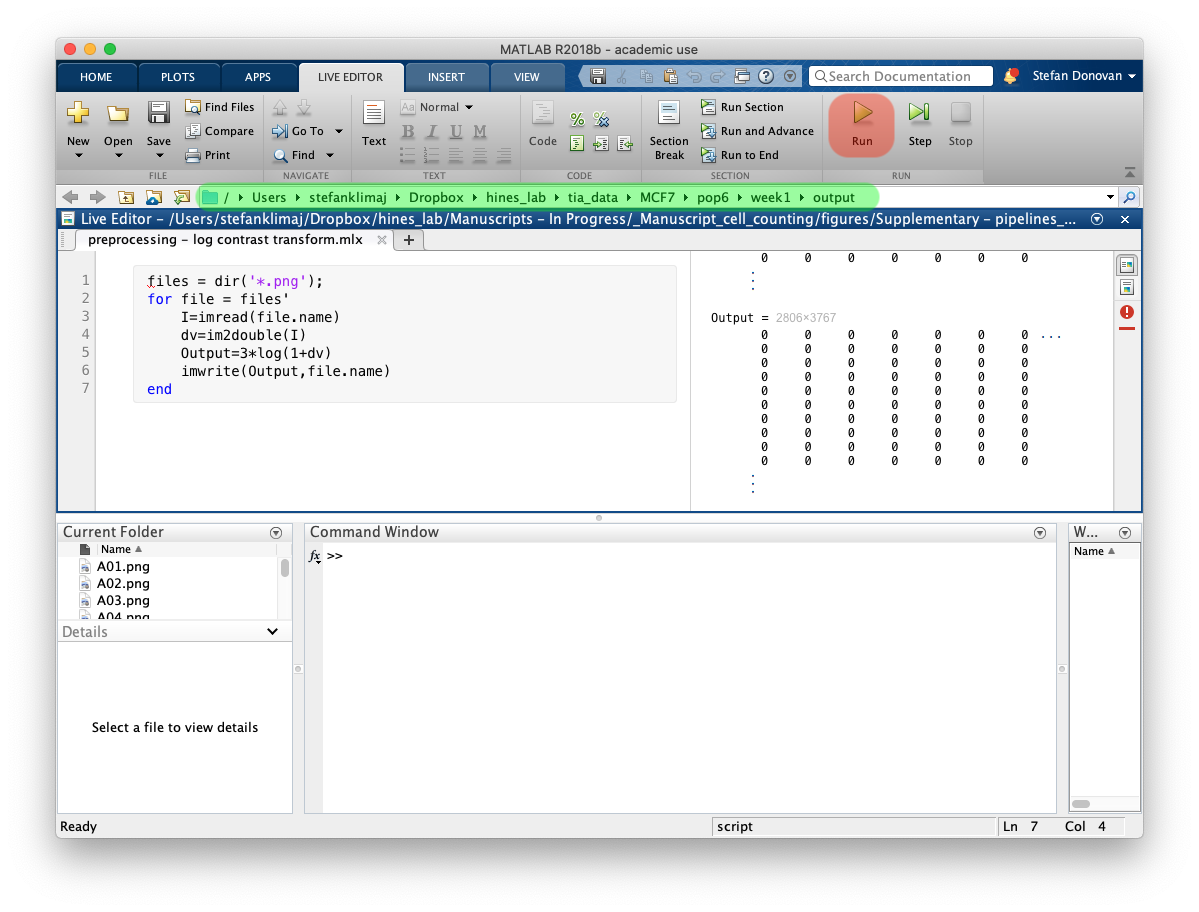
15) The Matlab script to perform the log contrast transformation is written to run iteratively on all .png files within a specified directory. Once the directory has been defined in working directory path (green highlight), click run (green play arrow – red highlight in above figure) to run script on all files within the directory. Again, is it strongly encouraged to run this on copies of your original data, so the original data is not changed. This should only be run once on an image set
TIP: Mac users, highlight the folder your images that are to be processed are being stored, and holding down the option key, click “edit” and select “copy as pathname”; press command+option+C on the keyboard to copy quickly to your clipboard. Windows users: Press and hold the Shift key, right click on the selected folder, release the Shift key, and click on “Copy as path” to copy the full path to the Clipboard.
Step 3: Analysis Pipeline – Counting Cell Nuclei:
16) Open “processing – counting pipeline.cpproj”
17) Images Module – Similar to step 3, we need to load in our images that are to be analyzed. These should be images that have already been processed through the two preprocessing pipelines such that they have been: converted to grayscale, cropped, and log contrast transformed. Highlight your images in the output folder and drag them into the images module, the images will then appear showing their filenames and the path they were taken from in output directory from preprocessing.
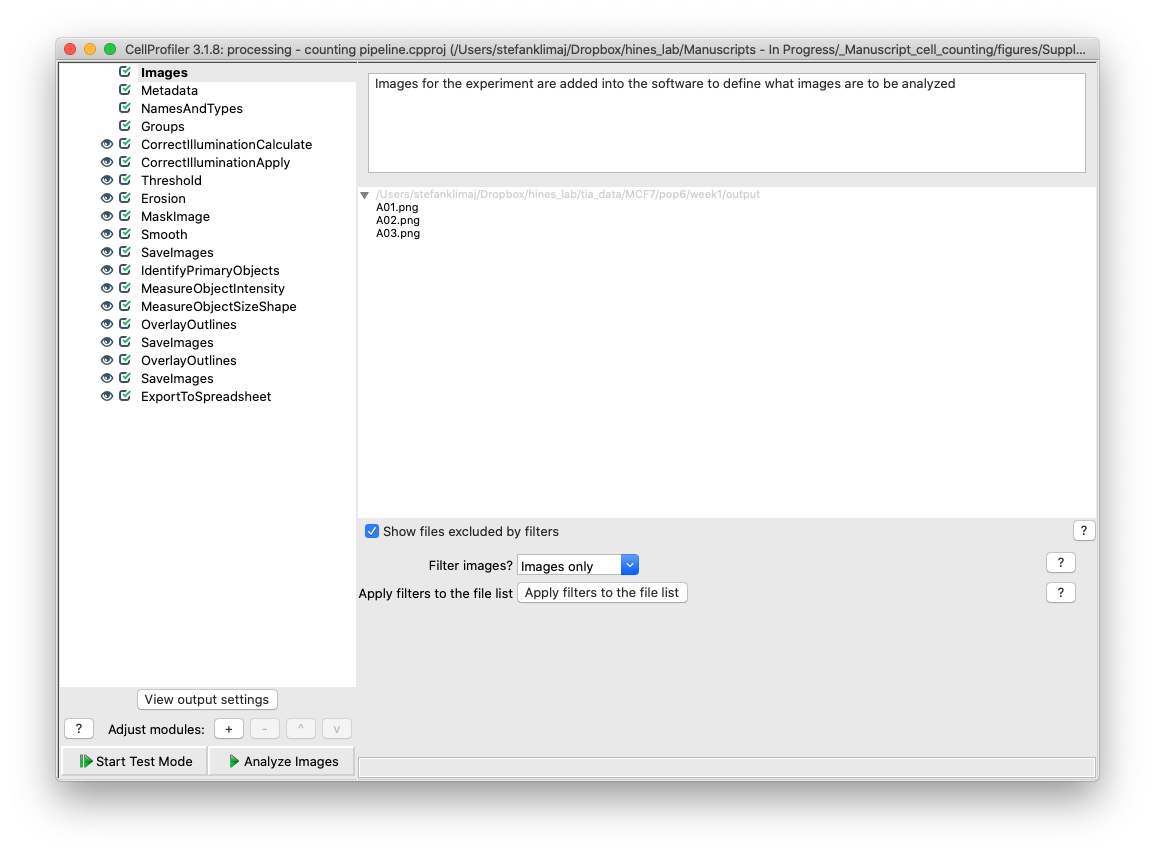
TIP) Since this step is very time and processing intensive, it is typically best to select a few representative images (i.e., have at least a nuclei present or is representative of the average image) to run through in either test mode or the full pipeline to test all of the modules. Testing the pipeline on a few test images will save time and allow for quick and easy fine tuning. See bottom of page suggestions section for more optimization suggestions for time saving steps in analysis.
18) Metadata Module – for this pipeline, metadata is extracted from the title of the images to define what images are analyzed. This could be useful if the user wishes to analyze only a subset of images (i.e., only row A and B)
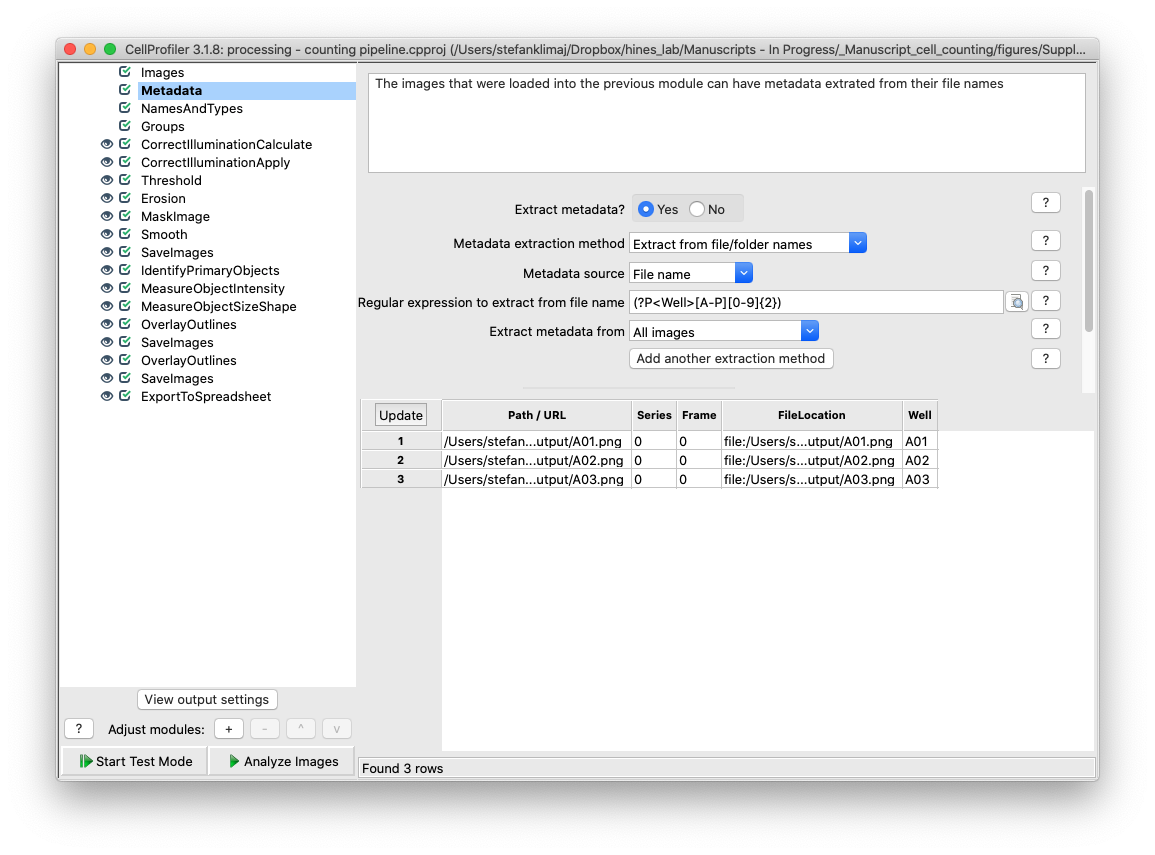
19) Names and Types Module – From the extracted metadata in the previous module, this module allows for the user to define rules for which images will be sent through the modules in this pipeline. The module by default is set to define all images from a 96 well plate to be processed if loaded into the images module.
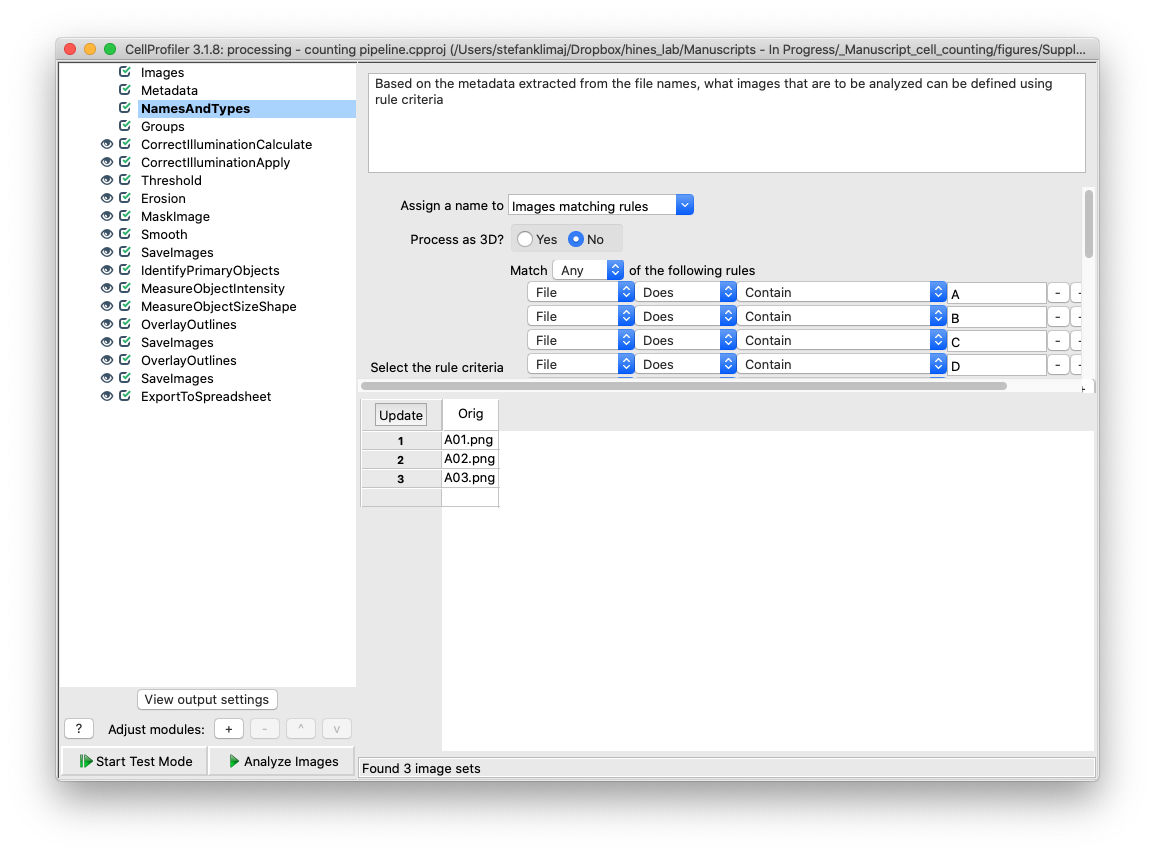
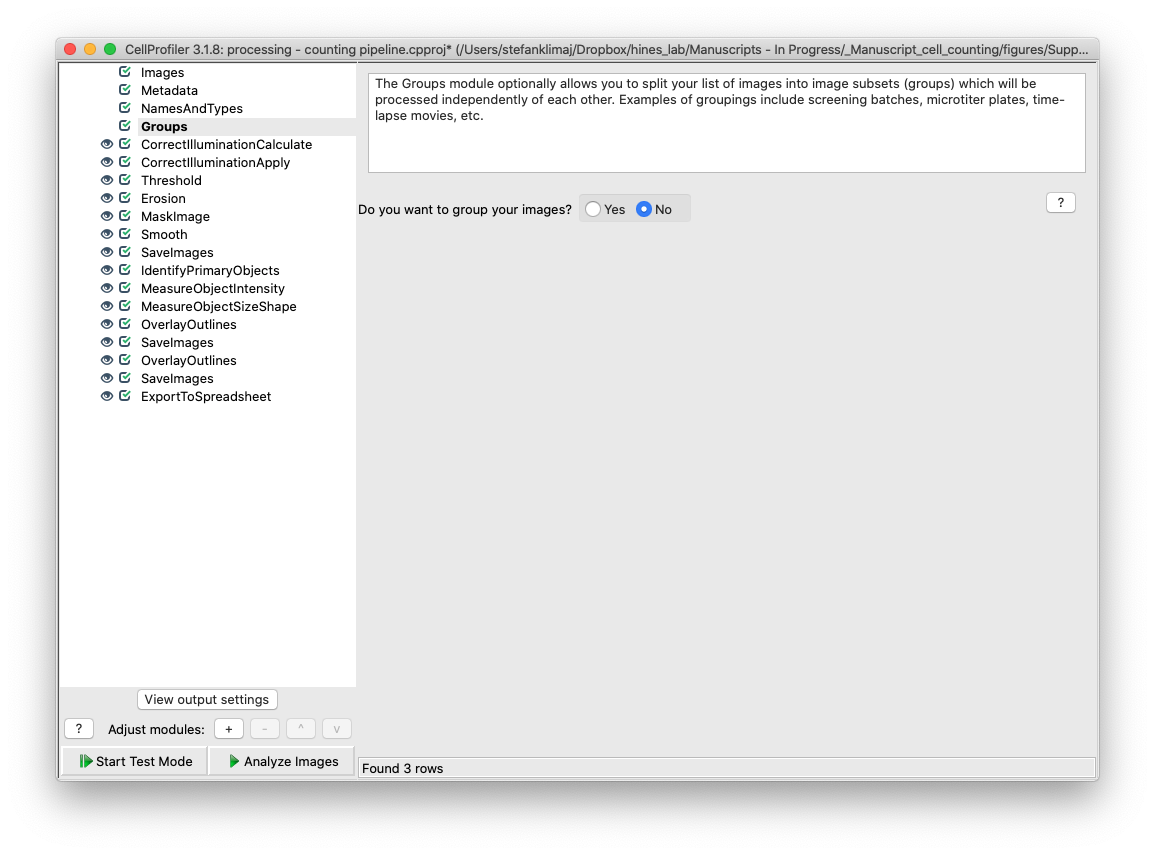
20) Groups module – the groups module is not used for this pipeline, since all wells are of the same experiment and are to be subjected to the same analysis. This module could be used to break images into subsets that are analyzed independently of each other.
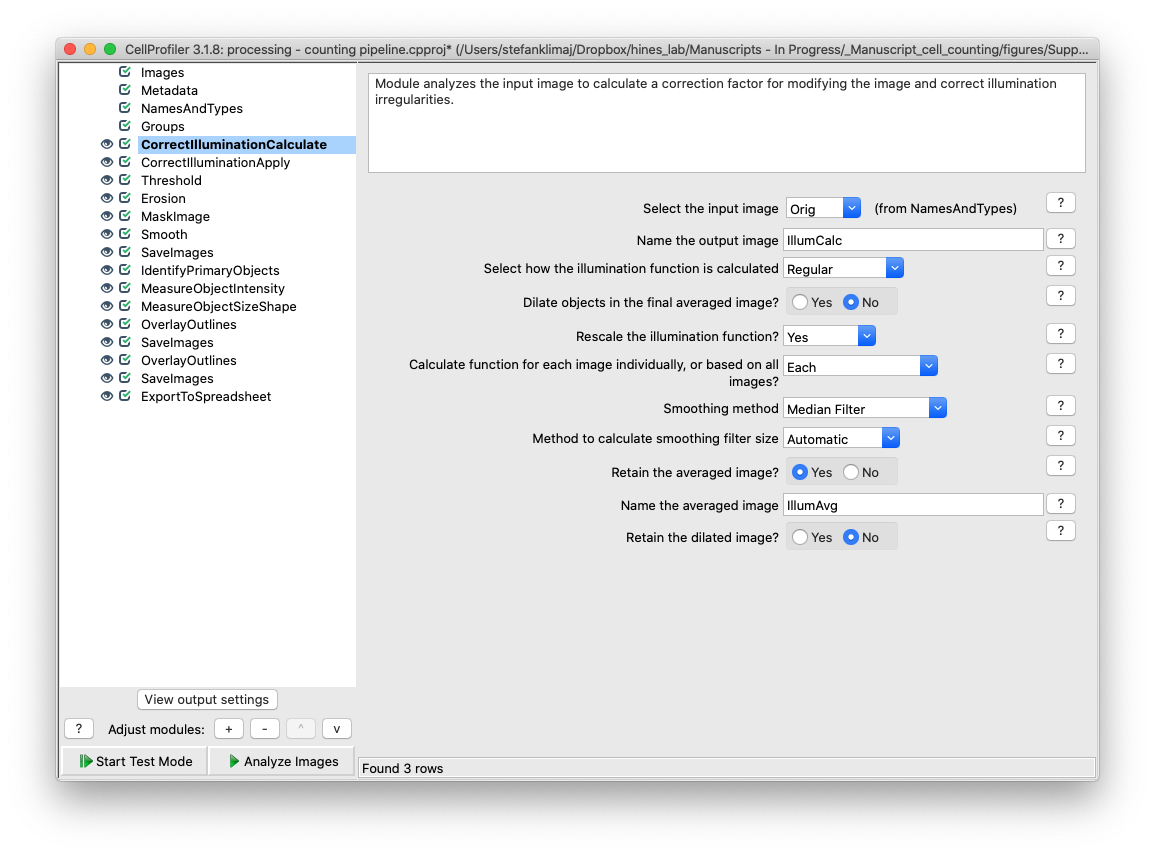
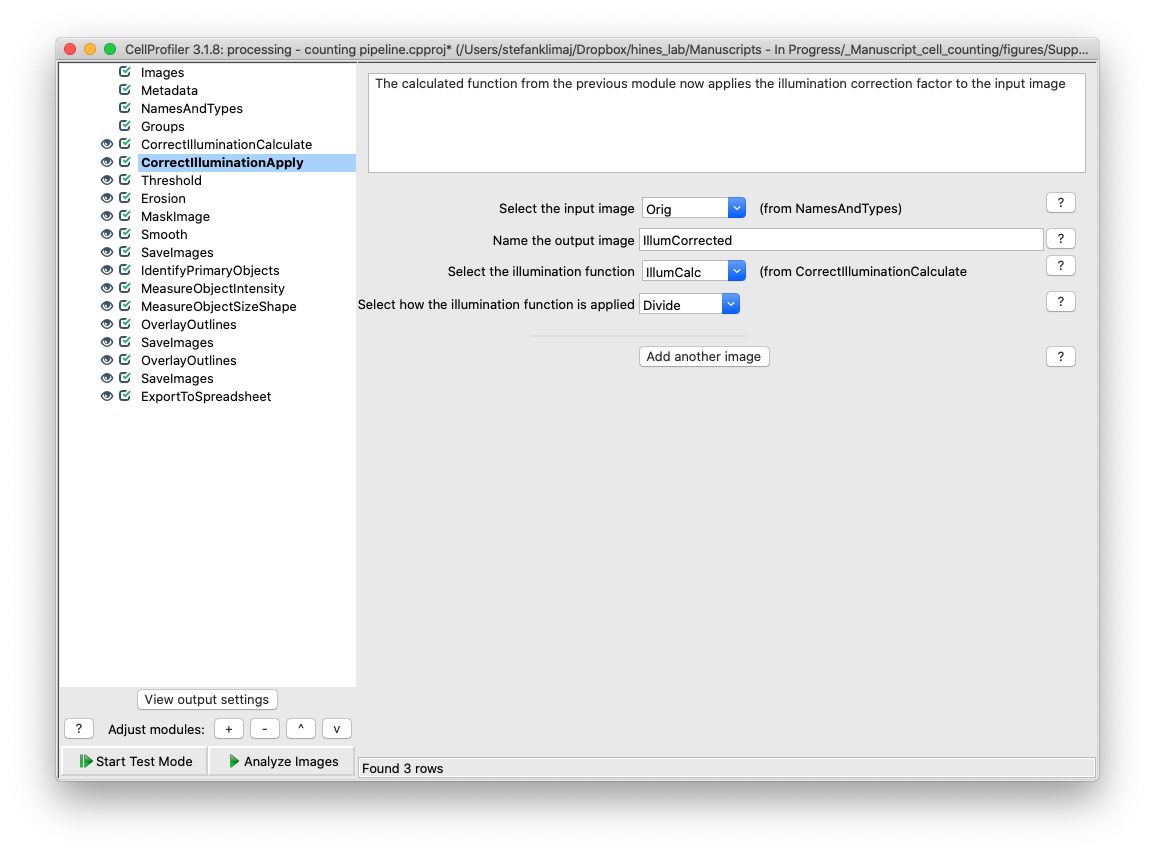
21 and 22) Correct Illumination Calculate and Correct Illumination Apply – These two modules are designed to remove the tiling artifact that is inherent to the Evos imaging platform. As images are acquired at 4x magnification, multiple images are taken and digitally sticked together to create a coherent image that is representative of the entire well. However, variable illumination causes a grid pattern to emerge in the final stitched image which needs to be removed to make the image more uniform before it can be analyzed for the cell nuclei signal – especially faint nuclei.
Expand on what each setting in this module does and why
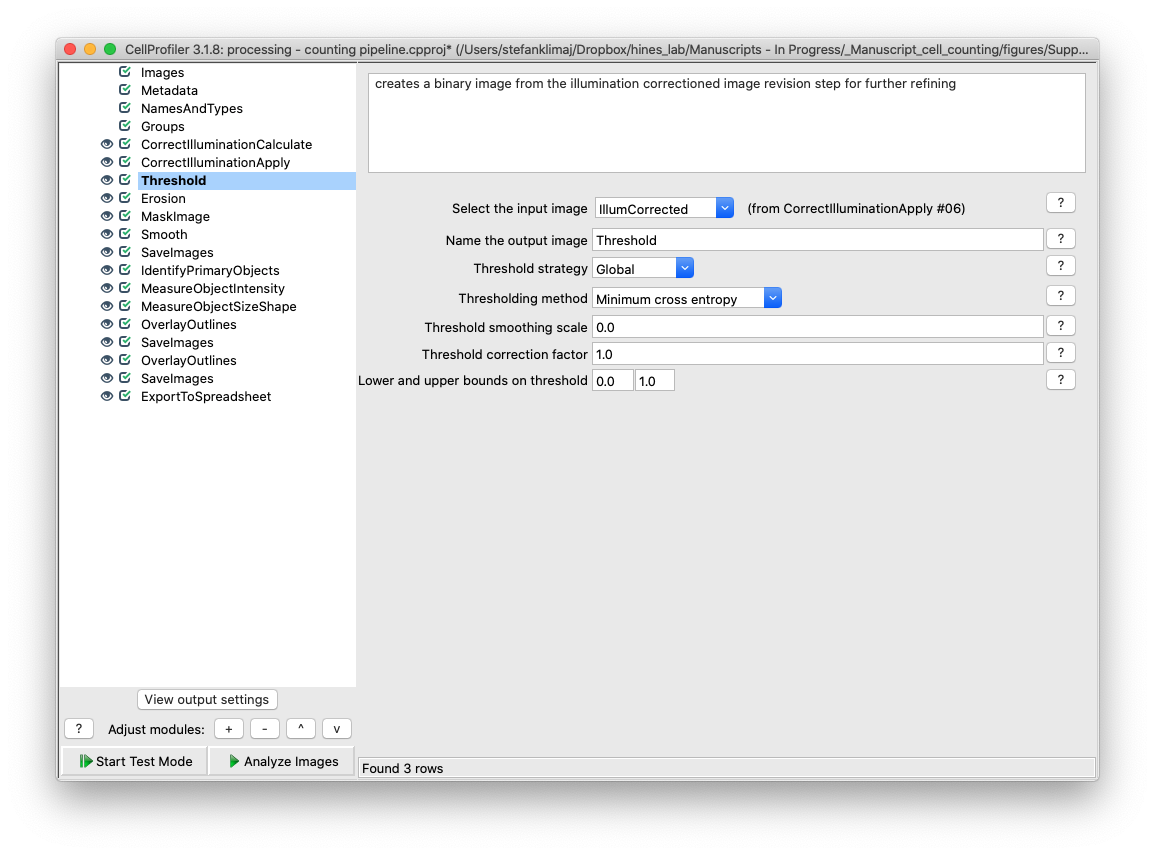
23) Threshold Module – this module creates a binary version of the image that has been corrected for its illumination artifacts, setting the values in the image to 1 (part of the ROI) or 0 (to be ignored)
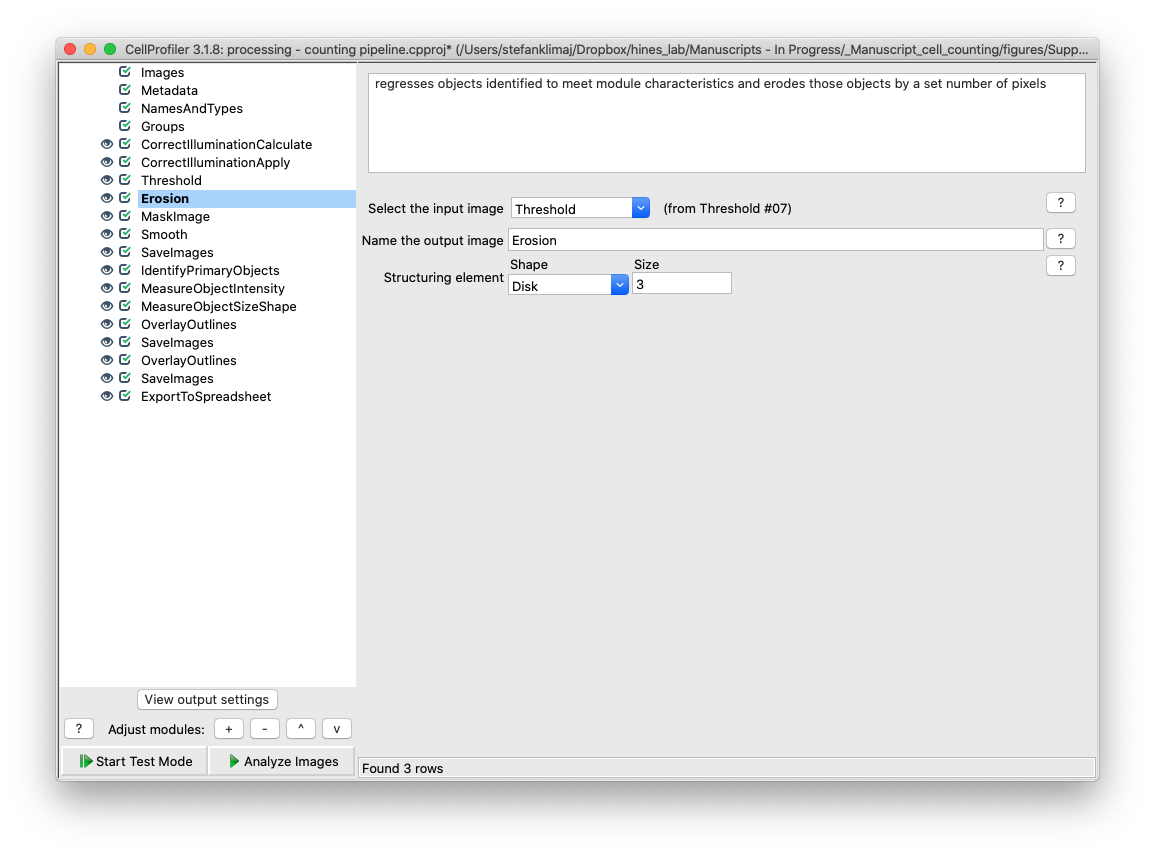
24) Erosion Module – This module takes the mask created in the previous step, and erodes (removes) pixels from the edges from the mask created in the previous step
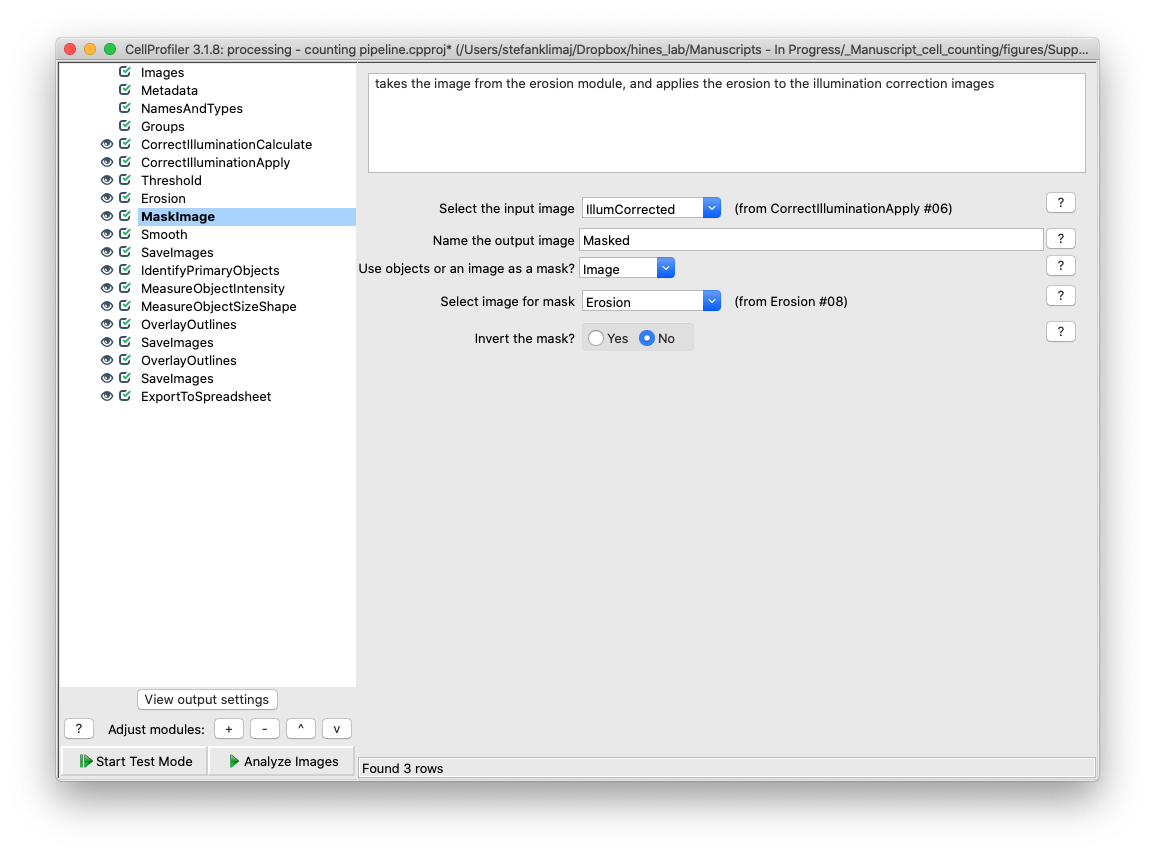
25) Mask Image Module – The mask image module now applies the mask of the eroded image from the previous two steps back to the illumination corrected image
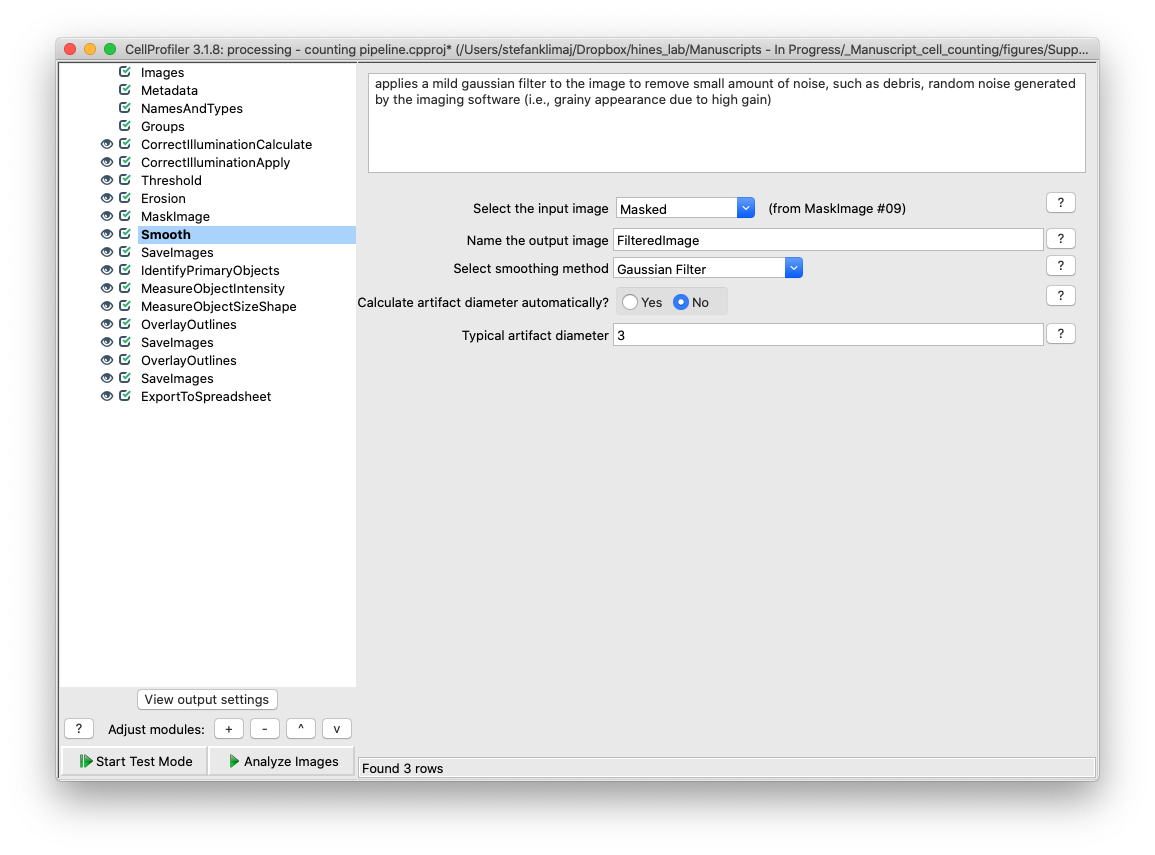
26) Smooth Module – The image that is created from steps 22-25 is smoothed with a mild gaussian blur to remove small artifacts from the image, such as random noise or small pieces of debris.
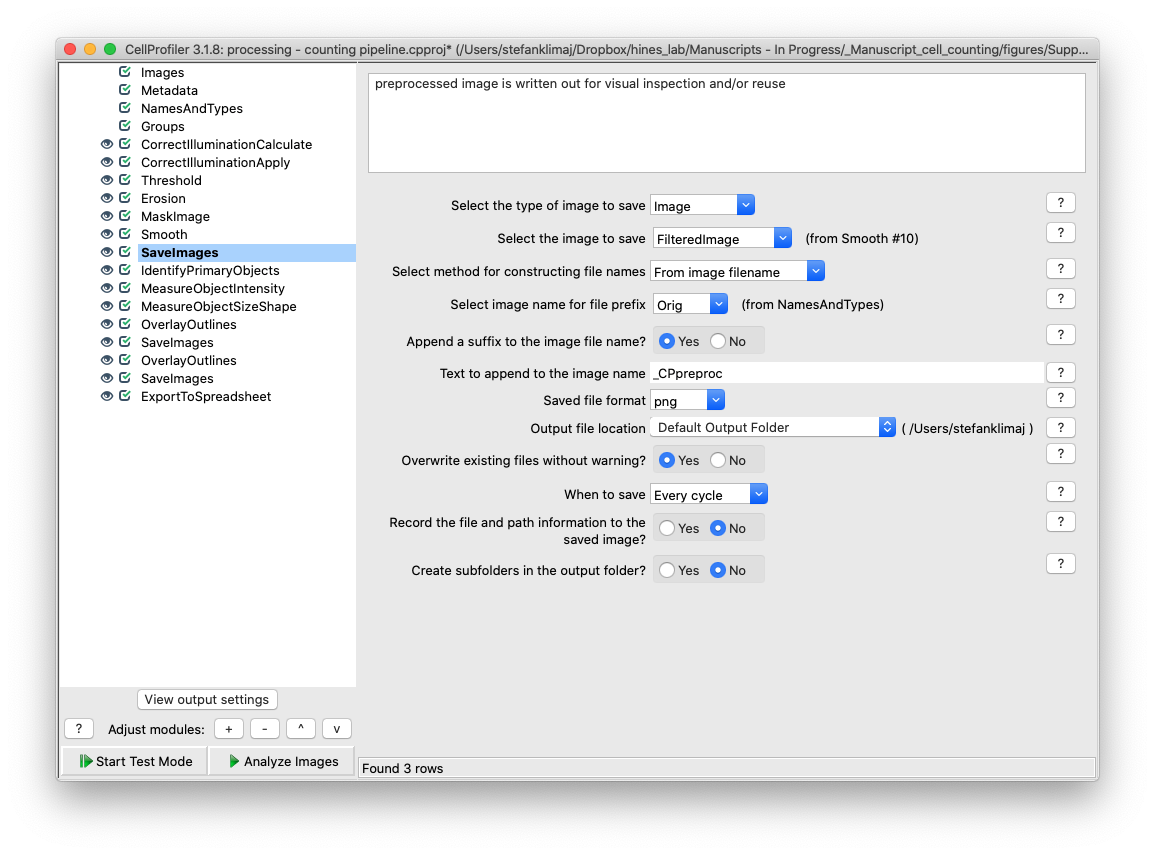
27) Save Images module – this save images module outputs the now preprocessed image from steps 22-26 for visual inspection prior to the image entering the phase of the pipeline where cells are counted. Importantly, this output image should be the reference image used to alter the settings in the Identify Primary Objects module as it is the input image.
28) Identify Primary Objects Module – This is the module that will finally begin counting the objects of interest in each well, the GFP labeled nuclei. This module has many different settings which can be customized, the only setting for the current analysis that need to be modified is the lower bound threshold for the cell nuclei intensity.
TIP: From the file menu, click “view image” and input the image that is output in the “save images” module from step 27. Mousing over the image allows for the intensity value to be displayed at the bottom right of the window, and zooming in using the spyglass on section of the images, determining the intensity values at the boarder of the cell nuclei versus the typical background intensity will help in determining the lower bound threshold value. You want a value that is high enough so as false positives are reduced, but not so high that the majority of cell nuclei are excluded from identification.
TIP: If you are analyzing cells with small nuclei (see step 9B for how to measure an object’s size in CellProfiler), the “typical diameter of objects, in pixel units” can be lowered to a smaller minimum or narrowed in range to more accurately reflect the objects of interest size range
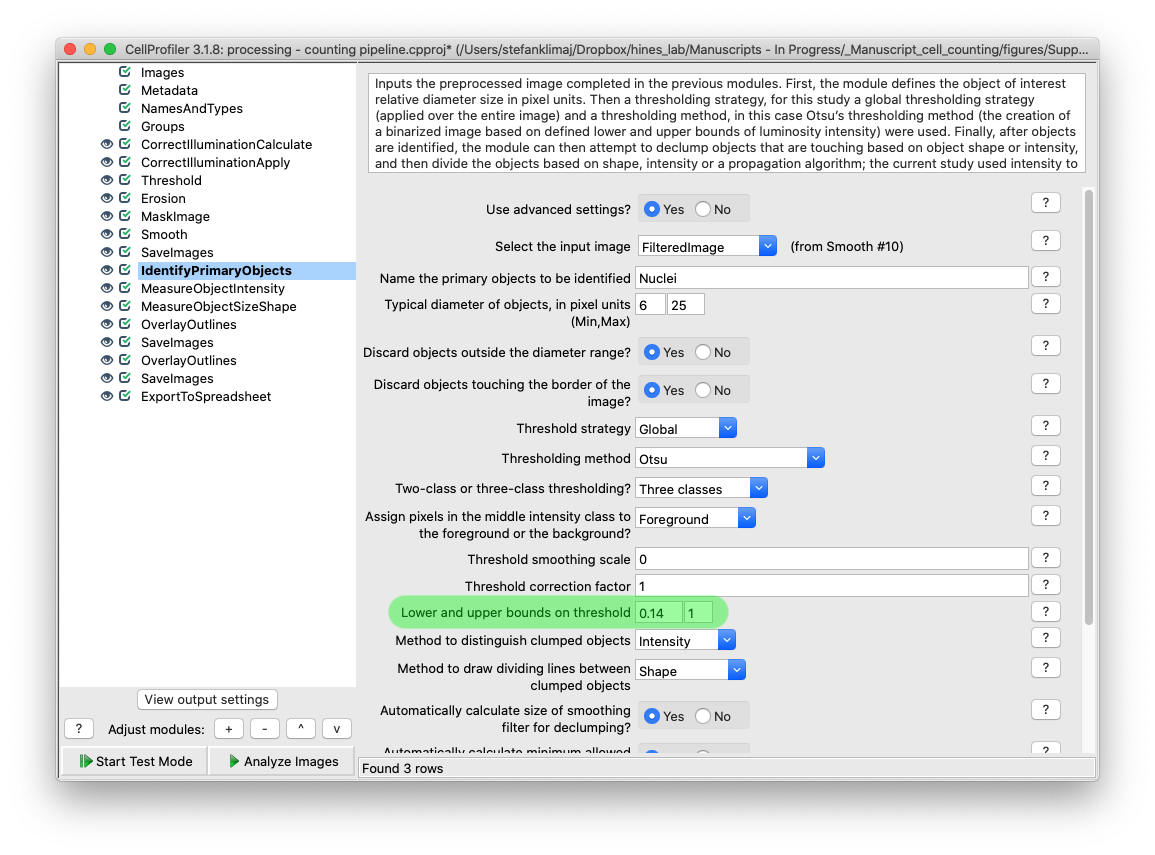
explanation of each identify module setting should go here – lots of stuff here
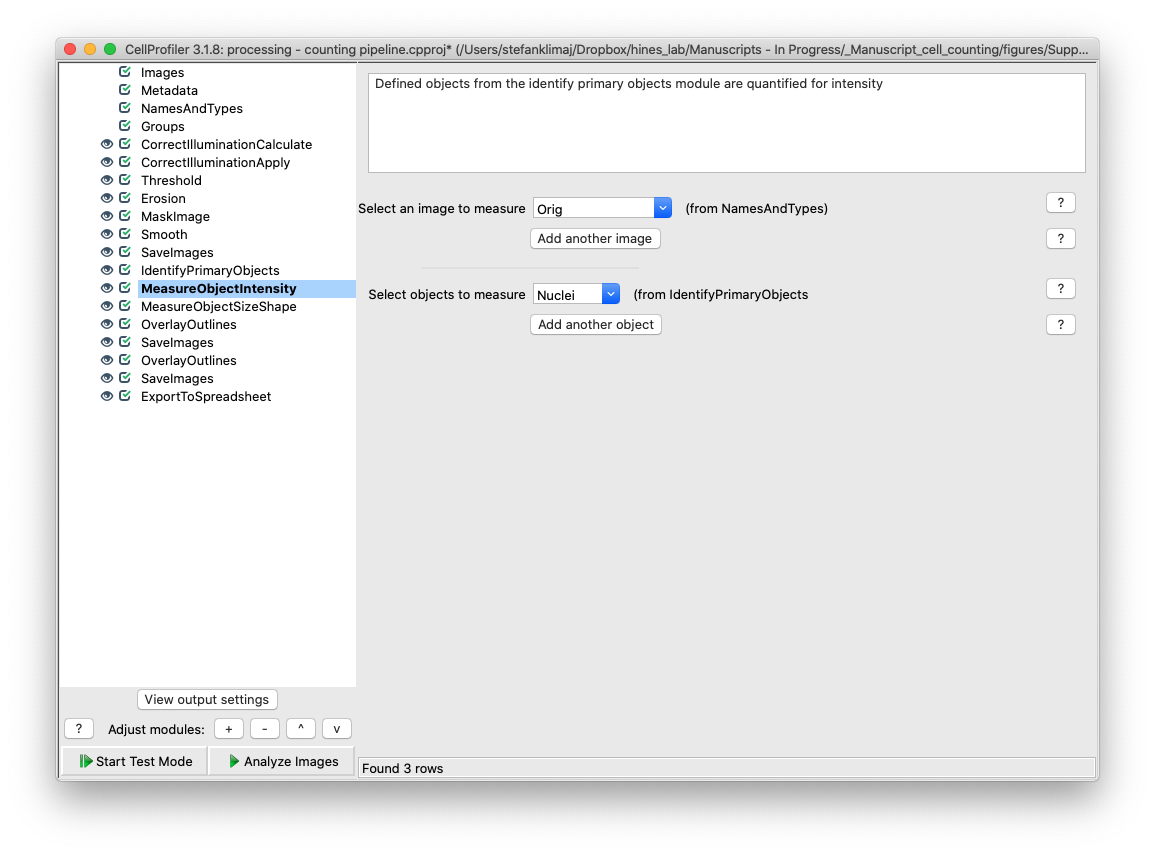
29) Measure Object Intensity – the identified objects from Identify Primary Objects Module are quantified for intensity.
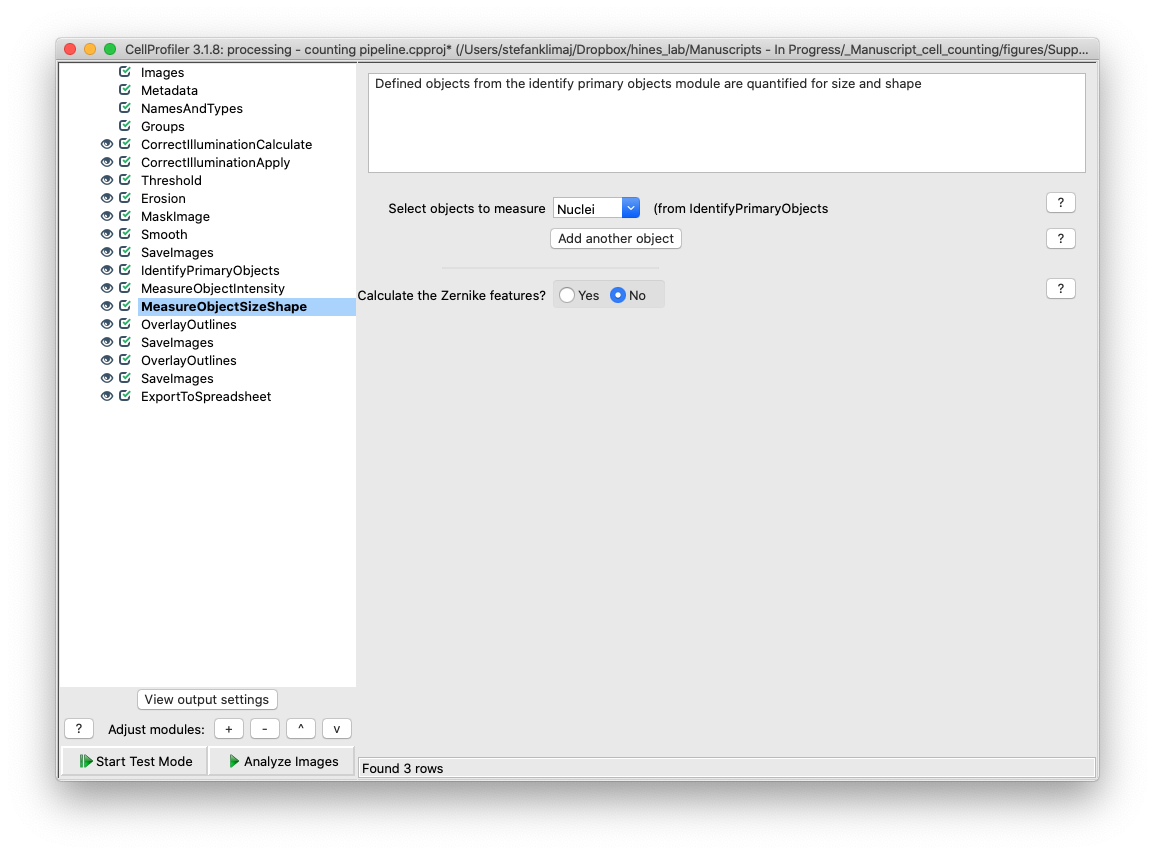
30) Measure Objects Size Shape Module – the objects identified from the identify primary objects module are quantified for size and shape.
31) Overlay Outlines – The objects identified from the identify primary objects module are overlaid onto the original input image
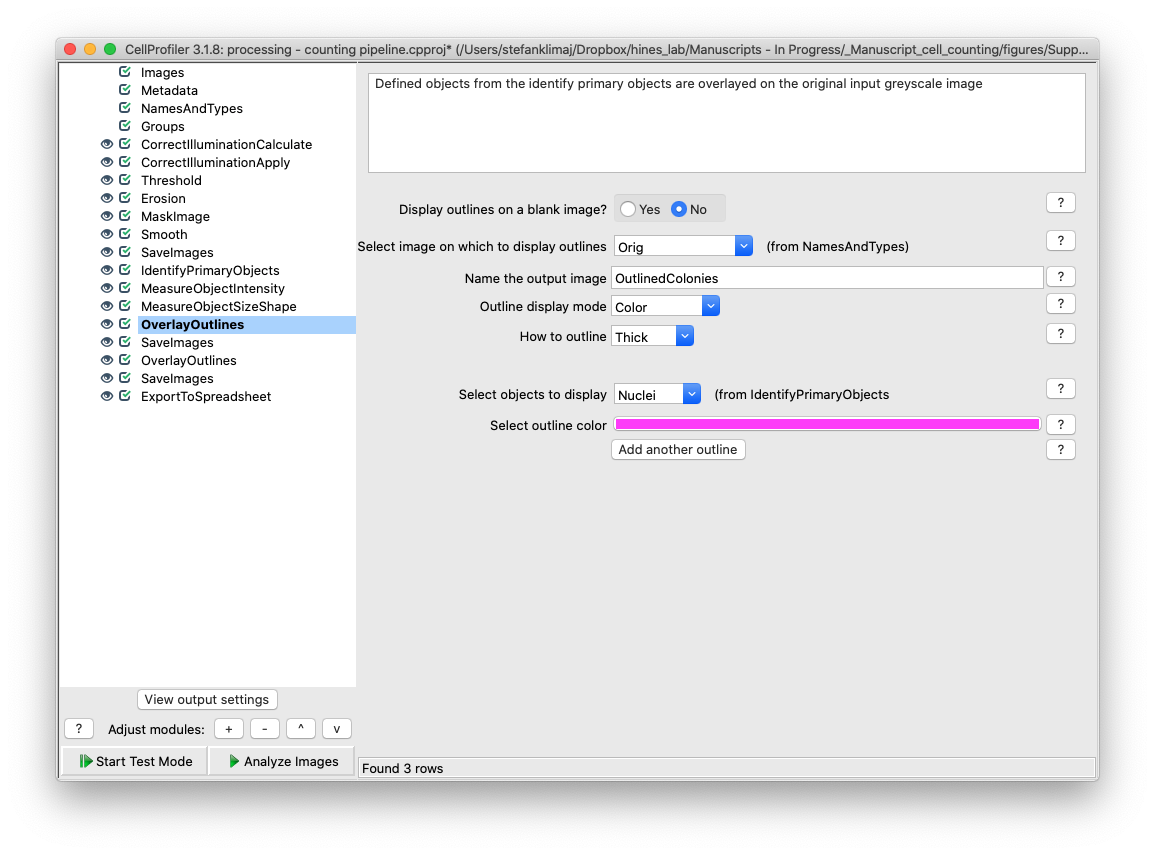
32) Save Images Module – The image with the outlined objects from the previous step is saved into the output folder
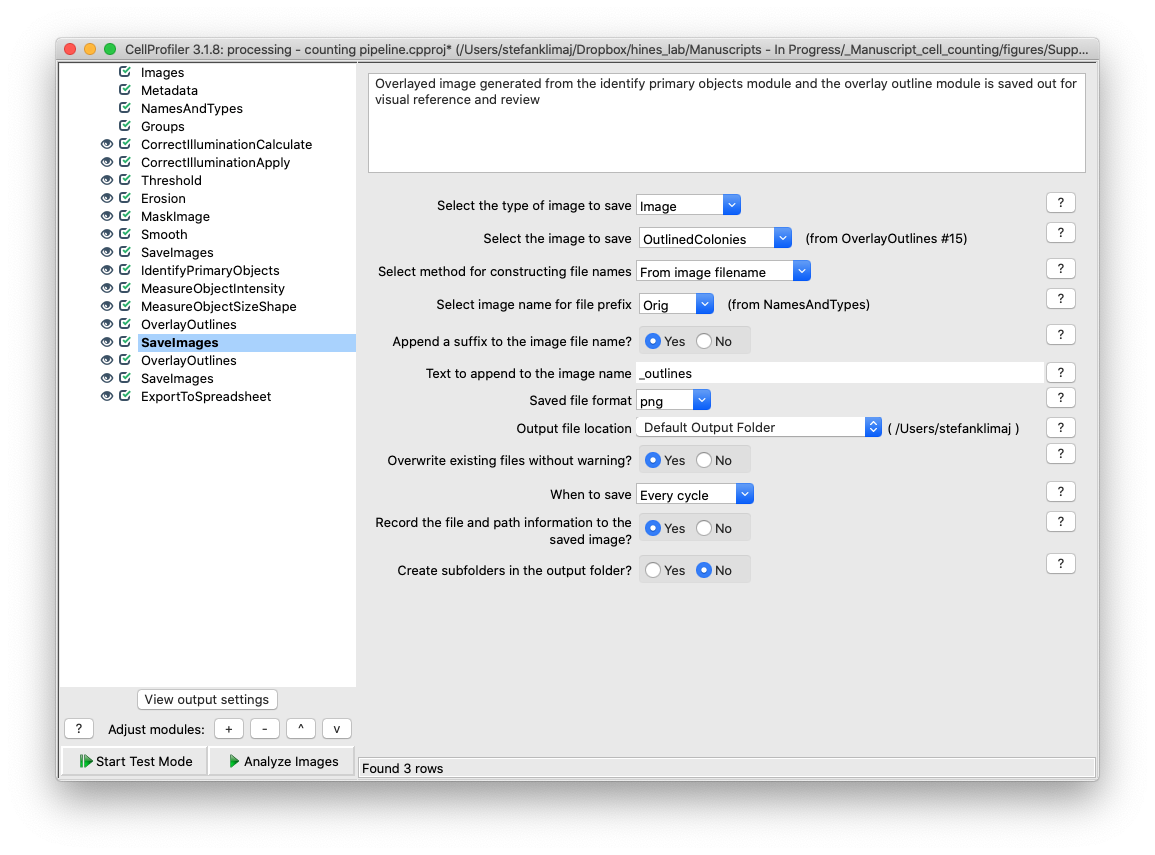
33) Overlay Outlines – The objects identified from the identify primary objects module are overlaid onto the preprocessed input image (after steps 22 through 26). This proved to be useful if the identify primary objects module failed to capture some cell nuclei, as loading this image back into Cell Profiler to check for intensity values and sizes of the missed object would aid in adjusting analysis parameters in step 28 to better capture all nuclei.
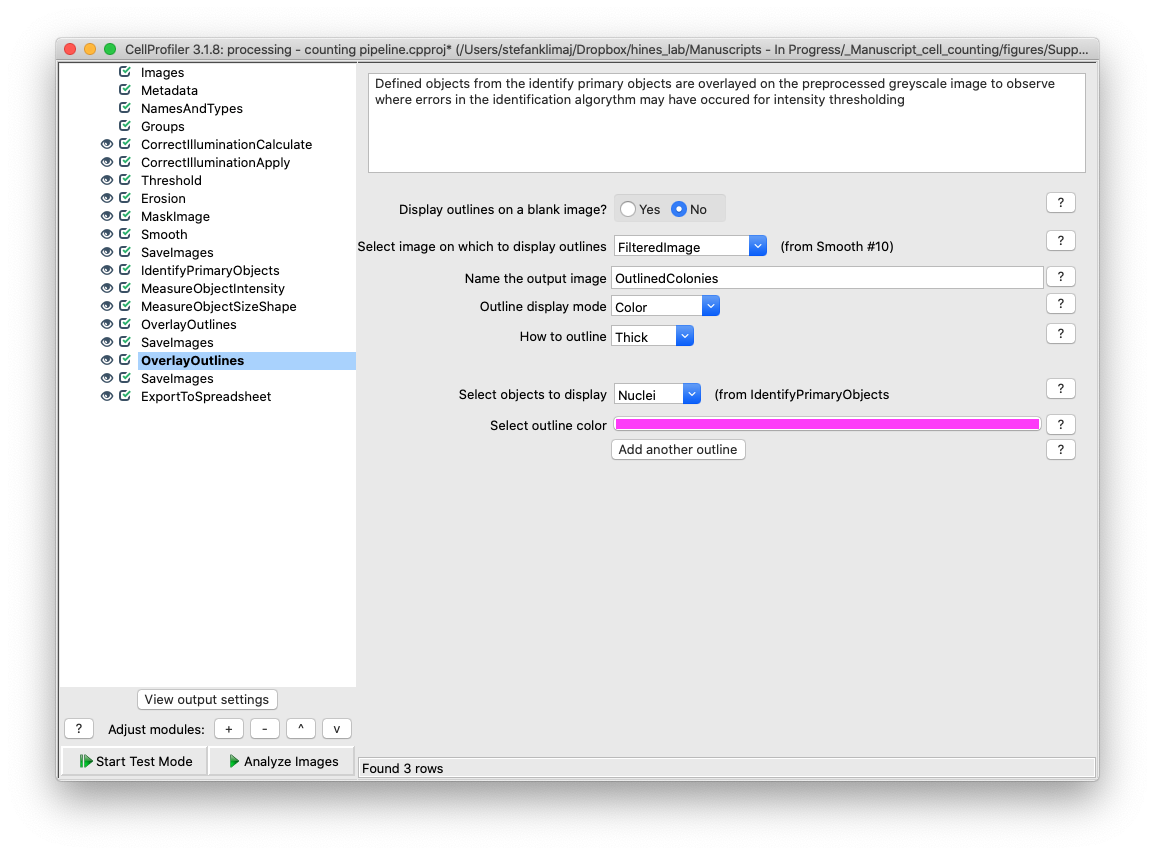
34) Save Images Module – the composite image from the previous step is saved into the default output folder
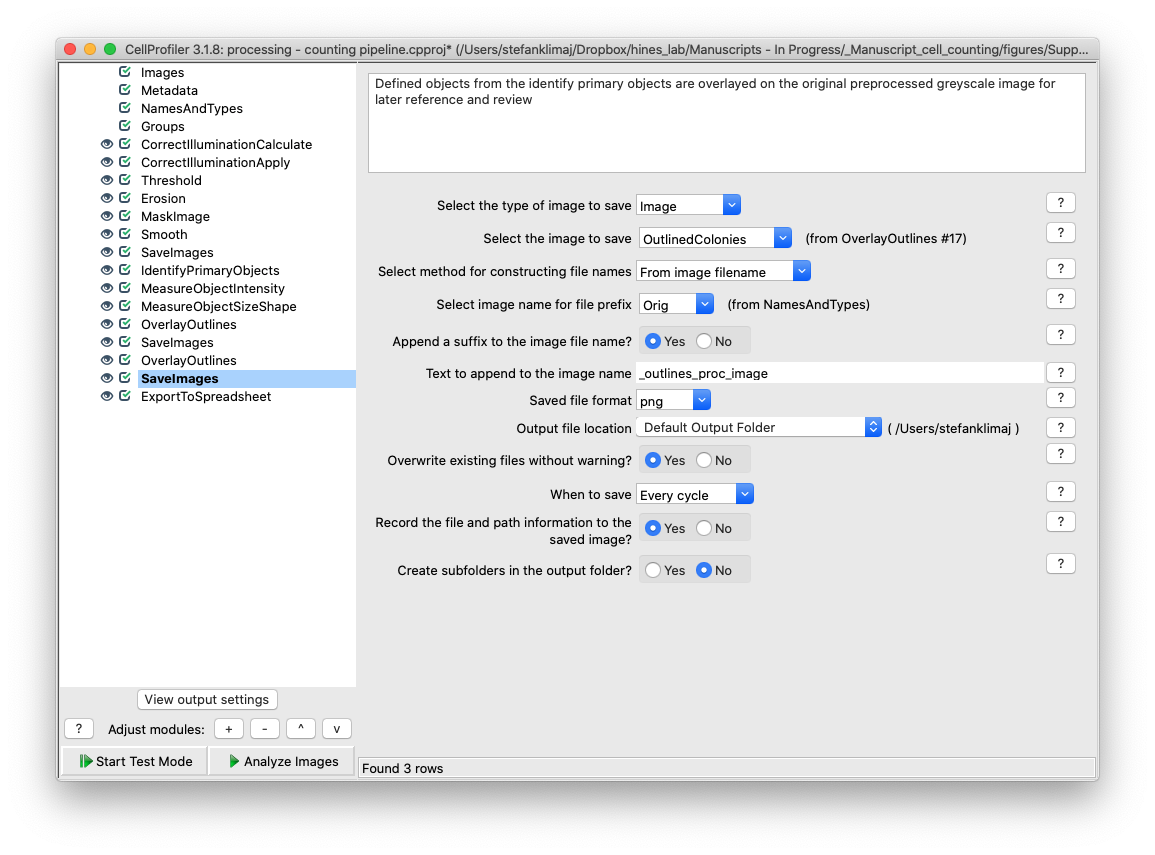
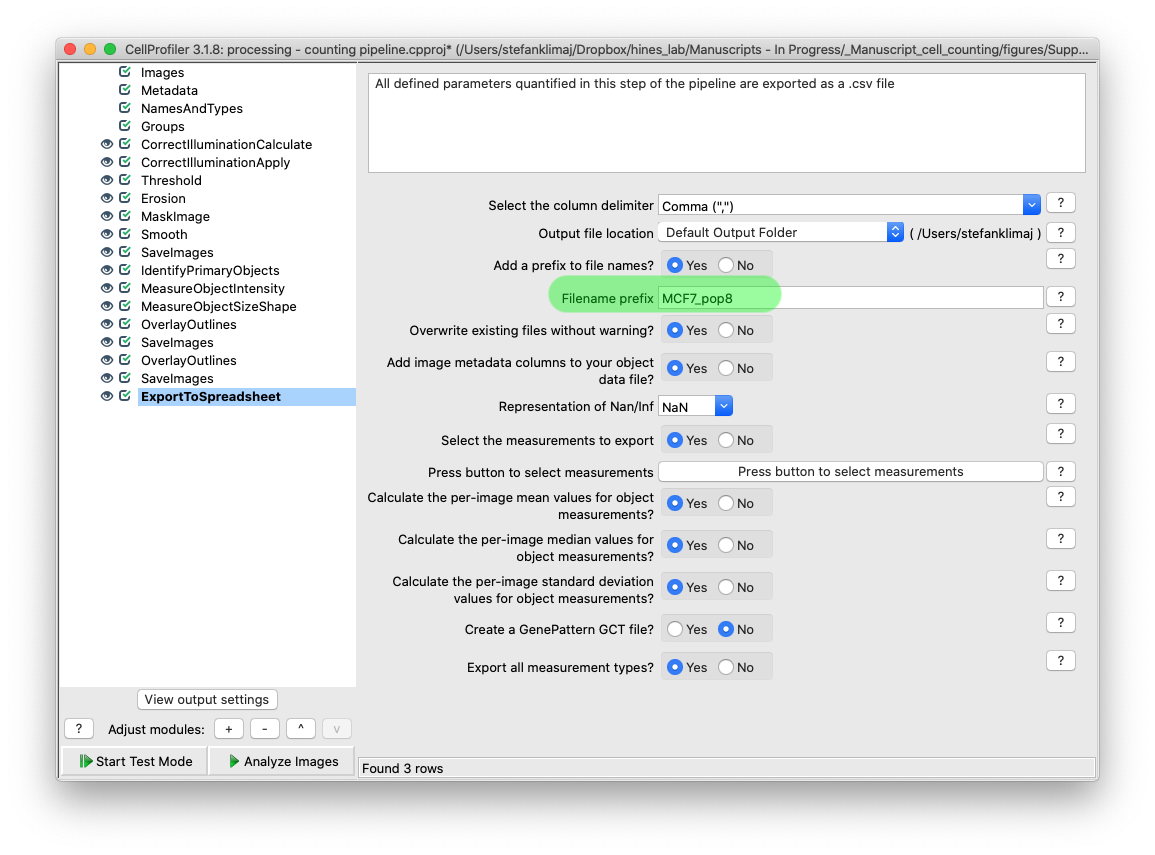
35) Export to Spreadsheet Module – This module allows for the quantified data to be exported into spreadsheet form so the data can be analyzed later. Changing the filename prefix will allow for better tracking of which experimental conditions and sets of images in those sets are part of the exported datasets.
